Il local outlier factor (LOF)

Introduzione all'Anomaly Detection in R

Alastair Rushworth

Data Scientist

Post-mortem sulla distanza kNN

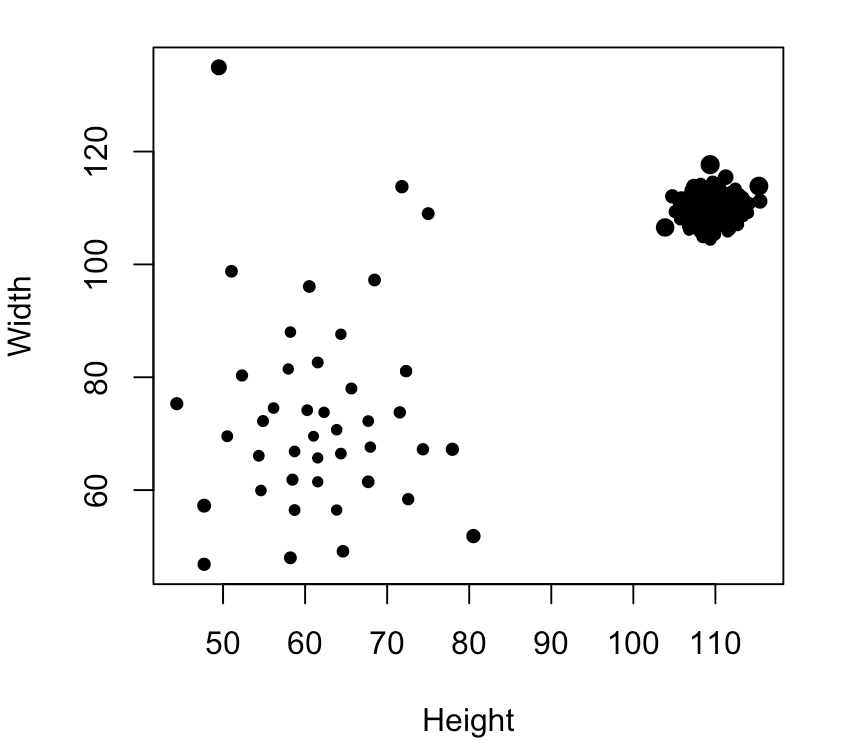
Anomalie globali vs locali
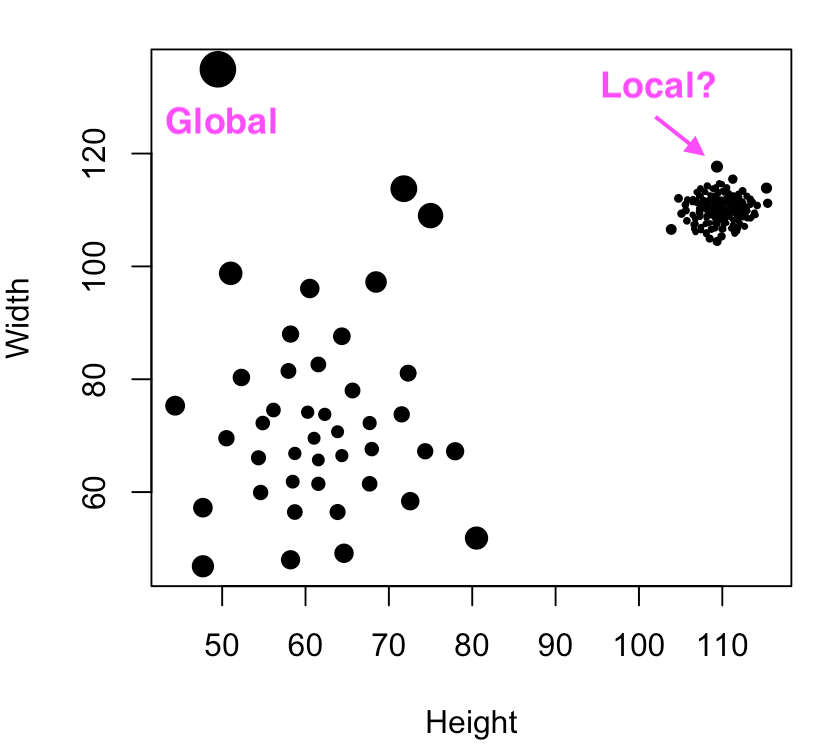
Introduzione all'Anomaly Detection in R

Calcolare il LOF

Calcola il LOF per i dati dei mobili

library(dbscan)
furniture_lof <- lof(scale(furniture), k = 5)

Guarda gli score

furniture_lof[1:10]
[1] 1.0649669 1.1071205 0.9980290 1.0392385 0.9725305
[6] 1.1933199 1.3210459 1.1409659 1.0613144 1.0805445
Introduzione all'Anomaly Detection in R

Interpretare il LOF

LOF è un rapporto di densità

  • LOF > 1: più probabile anomalia
  • LOF ≤ 1: meno probabile anomalia


Valori LOF alti indicano punti più isolati

Introduzione all'Anomaly Detection in R

Visualizzare il LOF

furniture$score_lof <- furniture_lof

plot(Width ~ Height, data = furniture, cex = score_lof, pch = 20)

Introduzione all'Anomaly Detection in R

Passiamo alla pratica!

Introduzione all'Anomaly Detection in R

Preparing Video For Download...