Visualizzare il punteggio di distanza kNN
Introduzione all'Anomaly Detection in R

Alastair Rushworth
Data Scientist
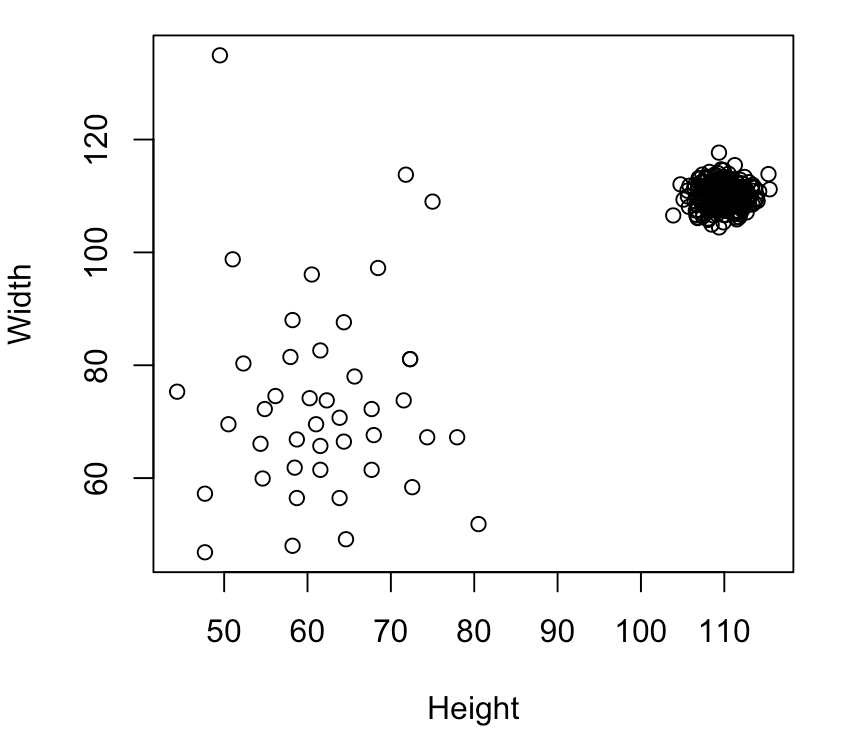
Standardizzare le scale delle feature
plot(Width ~ Height, data = furniture)
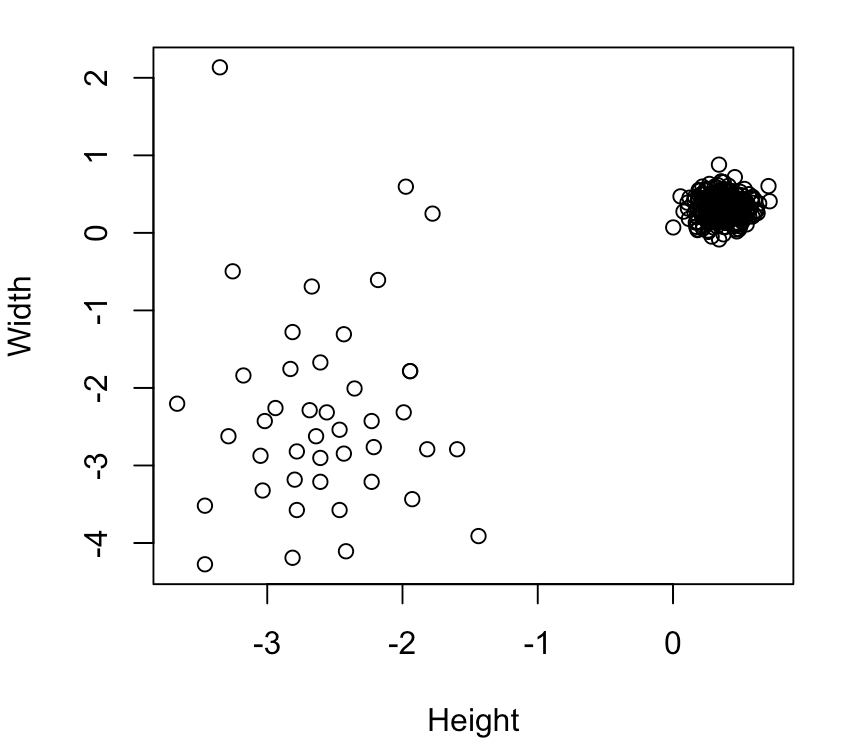
Standardizzare le feature
furniture_scaled <- scale(furniture)plot(Width ~ Height, data = furniture_scaled)
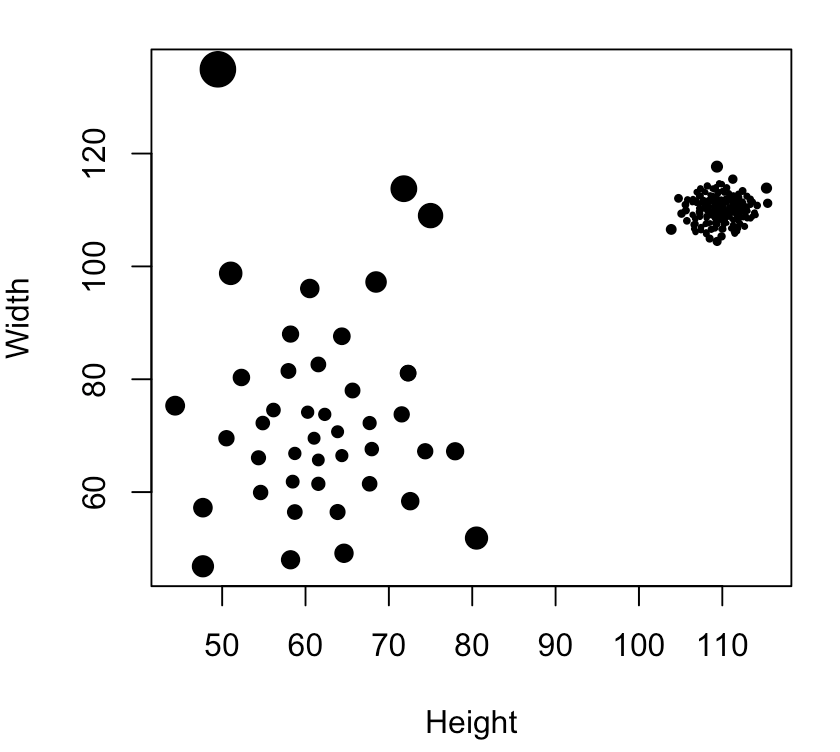
Visualizzare il punteggio di distanza
plot(Width ~ Height, cex = sqrt(score), data = furniture, pch = 20)