Hồi quy trung cấp với statsmodels trong Python
Maarten Van den Broeck
Content Developer at DataCamp
Khóa học này giả định kiến thức từ Introduction to Regression with statsmodels in Python
Hồi quy bội là mô hình hồi quy có hơn một biến giải thích.
Nhiều biến giải thích có thể mang lại thêm hiểu biết và dự đoán tốt hơn.
| mass_g | length_cm | species |
|---|---|---|
| 242.0 | 23.2 | Bream |
| 5.9 | 7.5 | Perch |
| 200.0 | 30.0 | Pike |
| 40.0 | 12.9 | Roach |
mass_g là biến phản hồifrom statsmodels.formula.api import ols
mdl_mass_vs_length = ols("mass_g ~ length_cm",
data=fish).fit()
print(mdl_mass_vs_length.params)
Intercept -536.223947
length_cm 34.899245
dtype: float64
mdl_mass_vs_species = ols("mass_g ~ species + 0",
data=fish).fit()
print(mdl_mass_vs_species.params)
species[Bream] 617.828571
species[Perch] 382.239286
species[Pike] 718.705882
species[Roach] 152.050000
dtype: float64
mdl_mass_vs_both = ols("mass_g ~ length_cm + species + 0",
data=fish).fit()
print(mdl_mass_vs_both.params)
species[Bream] -672.241866
species[Perch] -713.292859
species[Pike] -1089.456053
species[Roach] -726.777799
length_cm 42.568554
dtype: float64
print(mdl_mass_vs_length.params)
Intercept -536.223947
length_cm 34.899245
print(mdl_mass_vs_both.params)
species[Bream] -672.241866
species[Perch] -713.292859
species[Pike] -1089.456053
species[Roach] -726.777799
length_cm 42.568554
print(mdl_mass_vs_species.params)
species[Bream] 617.828571
species[Perch] 382.239286
species[Pike] 718.705882
species[Roach] 152.050000
import matplotlib.pyplot as plt
import seaborn as sns
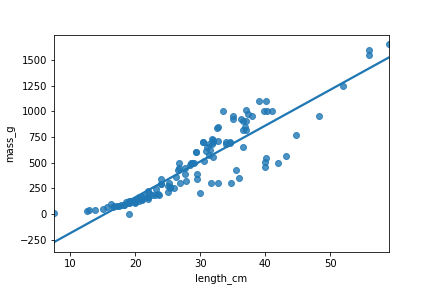
sns.regplot(x="length_cm",
y="mass_g",
data=fish,
ci=None)
plt.show()

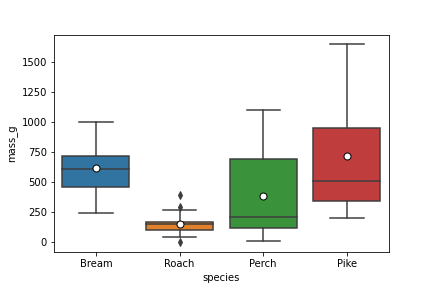
sns.boxplot(x="species",
y="mass_g",
data=fish,
showmeans=True)

coeffs = mdl_mass_vs_both.params
print(coeffs)
species[Bream] -672.241866
species[Perch] -713.292859
species[Pike] -1089.456053
species[Roach] -726.777799
length_cm 42.568554
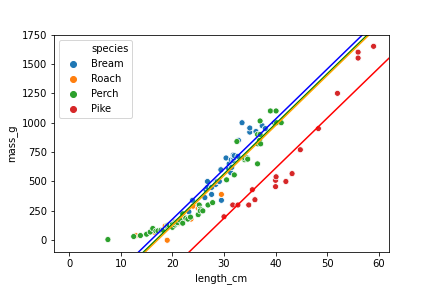
ic_bream, ic_perch, ic_pike, ic_roach, sl = coeffs
sns.scatterplot(x="length_cm",
y="mass_g",
hue="species",
data=fish)
plt.axline(xy1=(0, ic_bream), slope=sl, color="blue")
plt.axline(xy1=(0, ic_perch), slope=sl, color="green")
plt.axline(xy1=(0, ic_pike), slope=sl, color="red")
plt.axline(xy1=(0, ic_roach), slope=sl, color="orange")
Hồi quy trung cấp với statsmodels trong Python