Ôn tập xts và hàm plot()
Trực quan hóa dữ liệu chuỗi thời gian trong R

Arnaud Amsellem
Quantitative Trader and creator of the R Trader blog
Ôn tập về xts
- Lớp đối tượng đặc biệt để xử lý chuỗi thời gian
- eXtensible Time Series
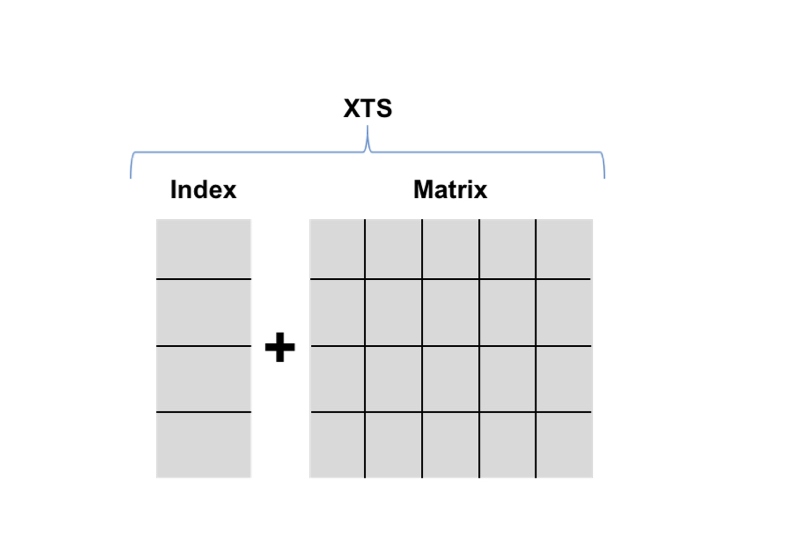
- xts = Chỉ mục thời gian + Ma trận
- Chỉ mục là đối tượng thời gian:
Date,POSIX Time,timeDate,chron
Dùng hàm plot()
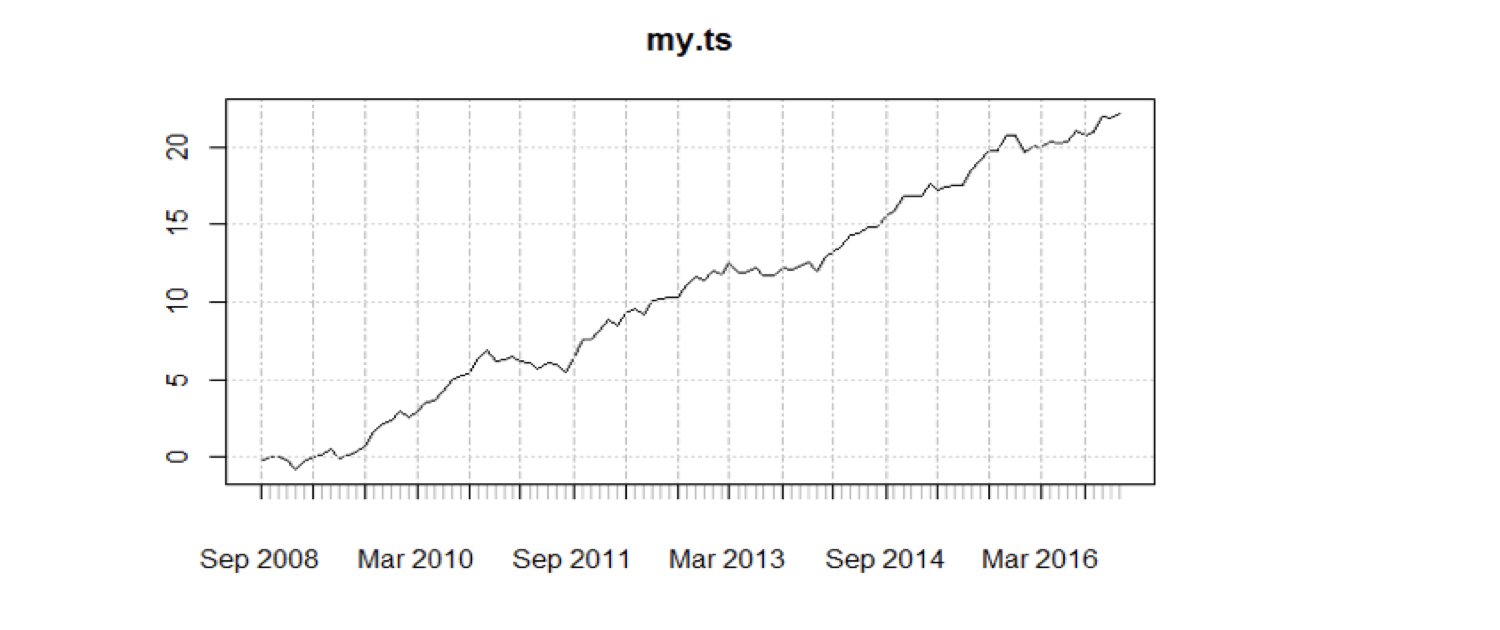
plot(my_ts)
Dùng hàm plot()
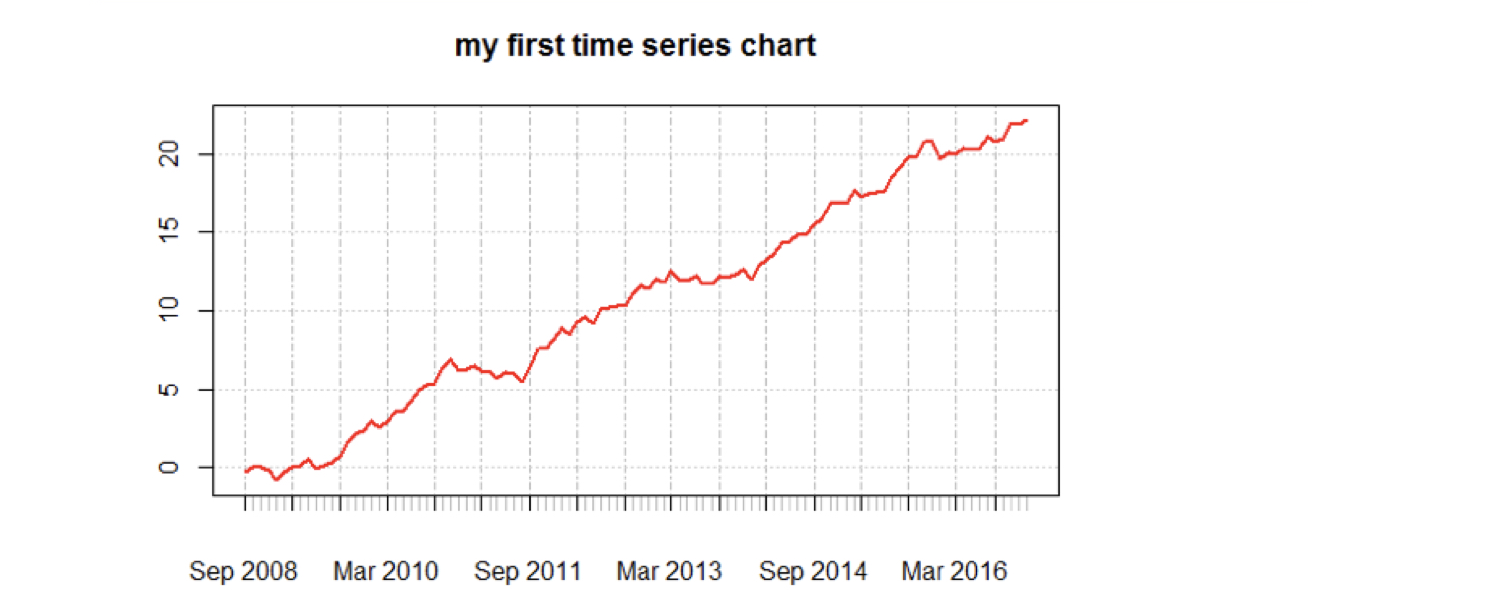
plot(my_ts, main = "my first time series")
lines(my_ts, col = "red", lwd = 2)
Dùng hàm plot()
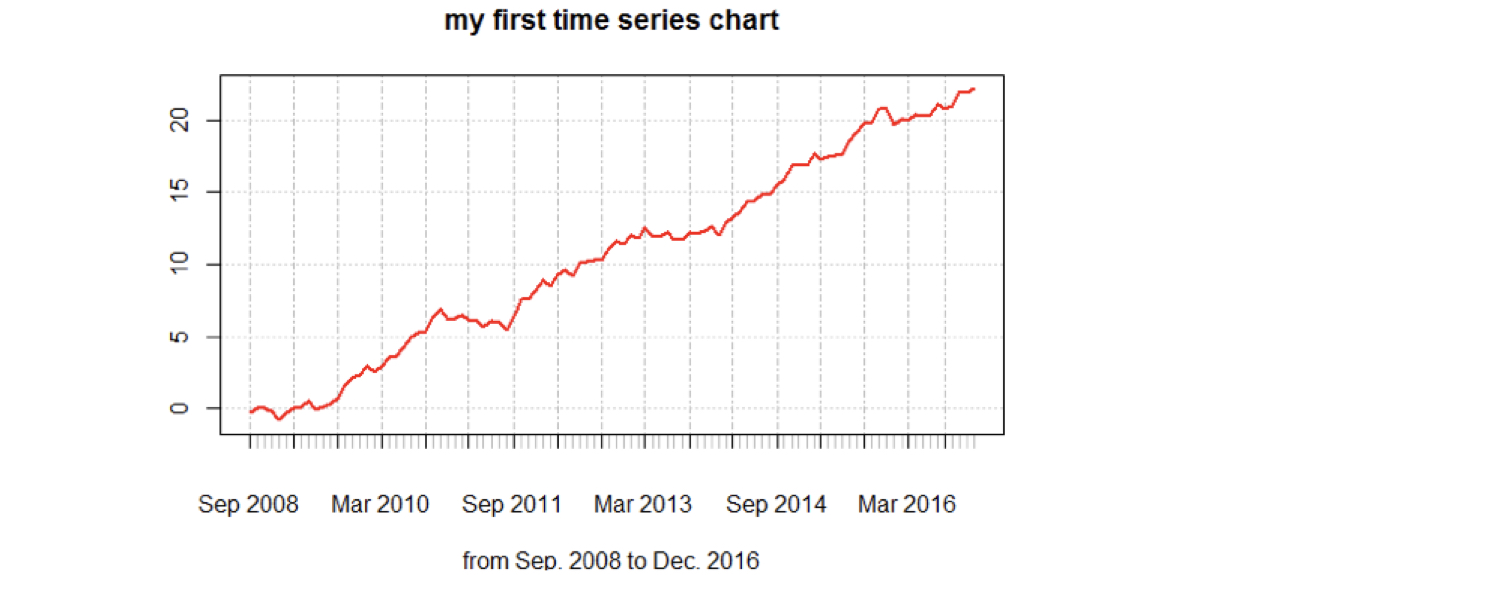
plot(my_ts, main = "my first time series",
            sub = "from Sep. 2008 to Dec. 2016")
lines(my_ts, col = "red", lwd = 2)

