Phát hiện trôi đơn biến

Giám sát Machine Learning bằng Python

Hakim Elakhrass

CEO and co-founder

Phát hiện trôi đơn biến là gì?
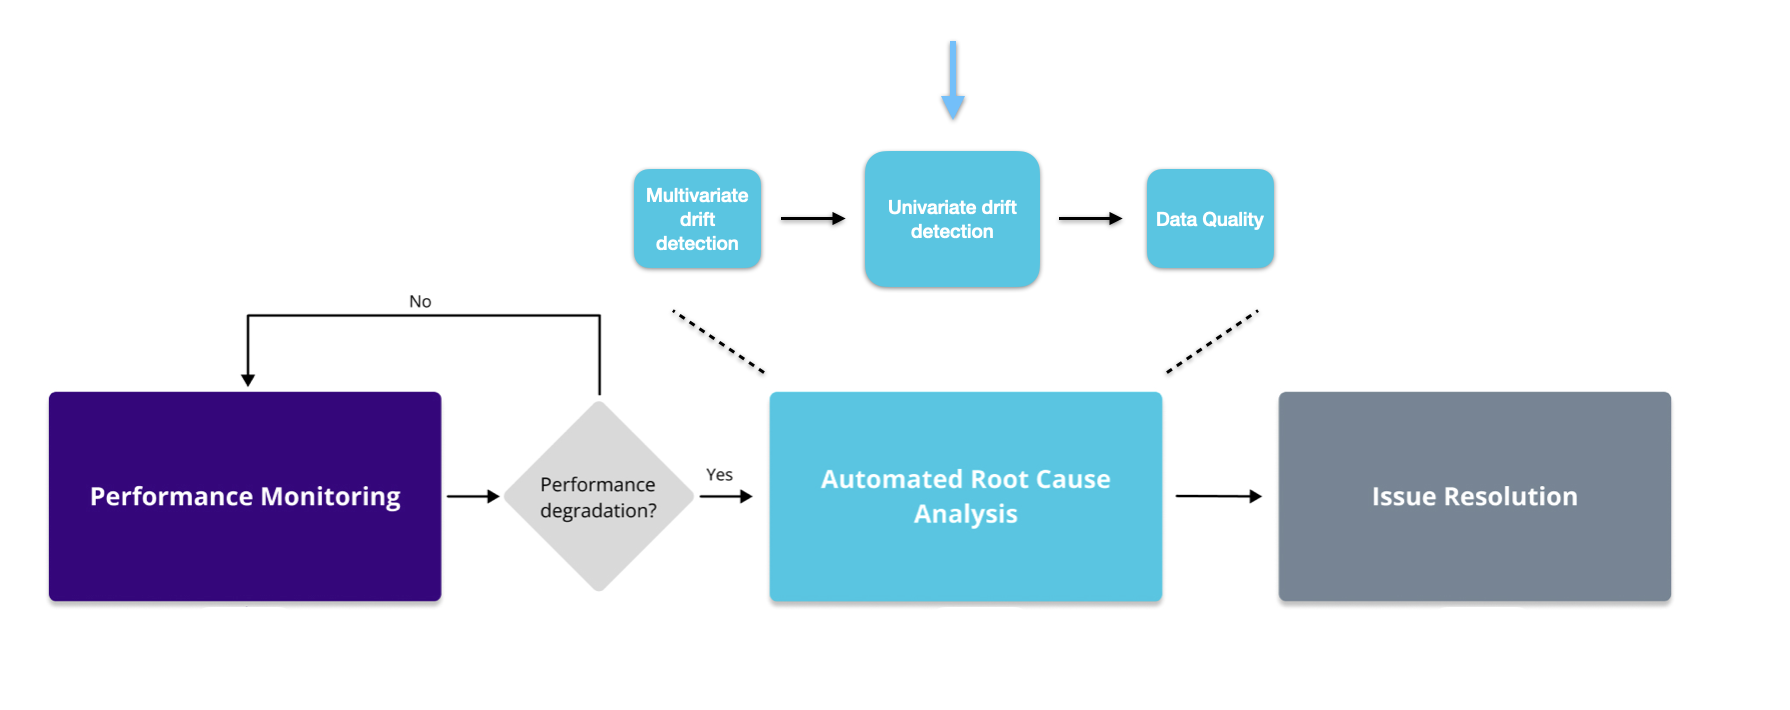
Hình cho thấy quy trình giám sát và vị trí của phương pháp đơn biến.

Giám sát Machine Learning bằng Python

Phương pháp đơn biến

  • Khoảng cách Jensen–Shannon - áp dụng cho cả phân loại và liên tục
  • Hellinger - phân loại và liên tục
  • Wasserstein - chỉ liên tục
  • Kolmogorov–Smirnov - chỉ liên tục

  • L-infinity - chỉ phân loại

  • Chi2 - chỉ phân loại

1 https://nannyml.readthedocs.io/en/stable/how_it_works/univariate_drift_comparison.html
Giám sát Machine Learning bằng Python

Triển khai mã

# Intialize the univariate drift calculator
uv_calc = nannyml.UnivariateDriftCalculator(
    continuous_methods=['wasserstein', 'hellinger'],
    categorical_methods=['jensen_shannon', 'l_infinity', 'chi2'],
    column_names=feature_column_names,
    timestamp_column_name='timestamp',
    chunk_period='d'
    )
# Fit, calculate and plot the results
uv_calc.fit(reference)
uv_results = uv_calc.calculate(analysis)
uv_results.plot().show()
Giám sát Machine Learning bằng Python

Lọc

  • Dựa trên tên cột
  • Dựa trên phương pháp đơn biến
# Filter the univariate results
filtered_figure = uv_results.filter(column_names=['trip_distance', 'fare_amount'], 
            methods=['jensen_shannon'])

# Plot the filtered results
filtered_figure.show().plot()
Giám sát Machine Learning bằng Python

Xếp hạng theo số cảnh báo

  • Xếp hạng đặc trưng theo số cảnh báo
# Initialize the alert count ranker
alert_count_ranker = nannyml.AlertCountRanker()
alert_count_ranked_results = alert_count_ranker.rank(
    uv_results,
    only_drifting=False)
# Display the results
display(alert_count_ranked_results)
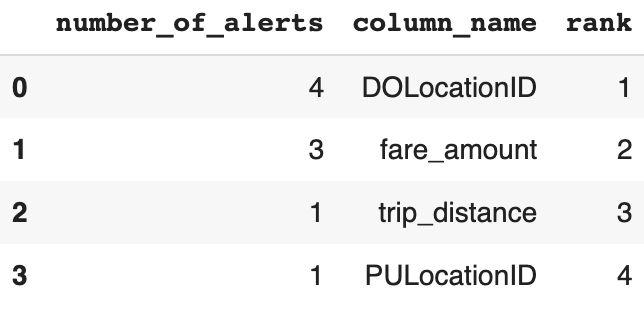
Hình hiển thị dataframe với số cảnh báo theo từng đặc trưng.

Giám sát Machine Learning bằng Python

Xếp hạng theo tương quan

  • Xếp hạng đặc trưng theo mức tương quan với thay đổi hiệu suất tuyệt đối
# Initialize the correlation ranker
correlation_ranker = nannyml.CorrelationRanker()
correlation_ranker.fit(perf_results.filter(period='reference'))
correlation_ranked_results = correlation_ranker.rank(uv_results, perf_results)

# Display the results
display(correlation_ranked_results)
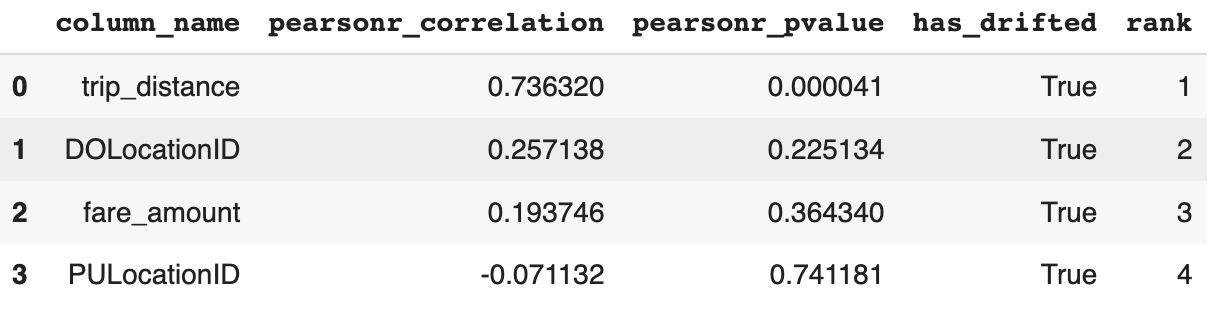
Hình hiển thị dataframe với hệ số tương quan Pearson và p-value cho từng đặc trưng.

Giám sát Machine Learning bằng Python

Giám sát phân phối đặc trưng

  • Cho hiểu sâu hơn và tăng khả năng giải thích
# Create distribution plots
distribution_results = uv_results.plot(kind='distribution')

# Show the plots
distribution_results.show()
Giám sát Machine Learning bằng Python

Biểu đồ phân phối đặc trưng


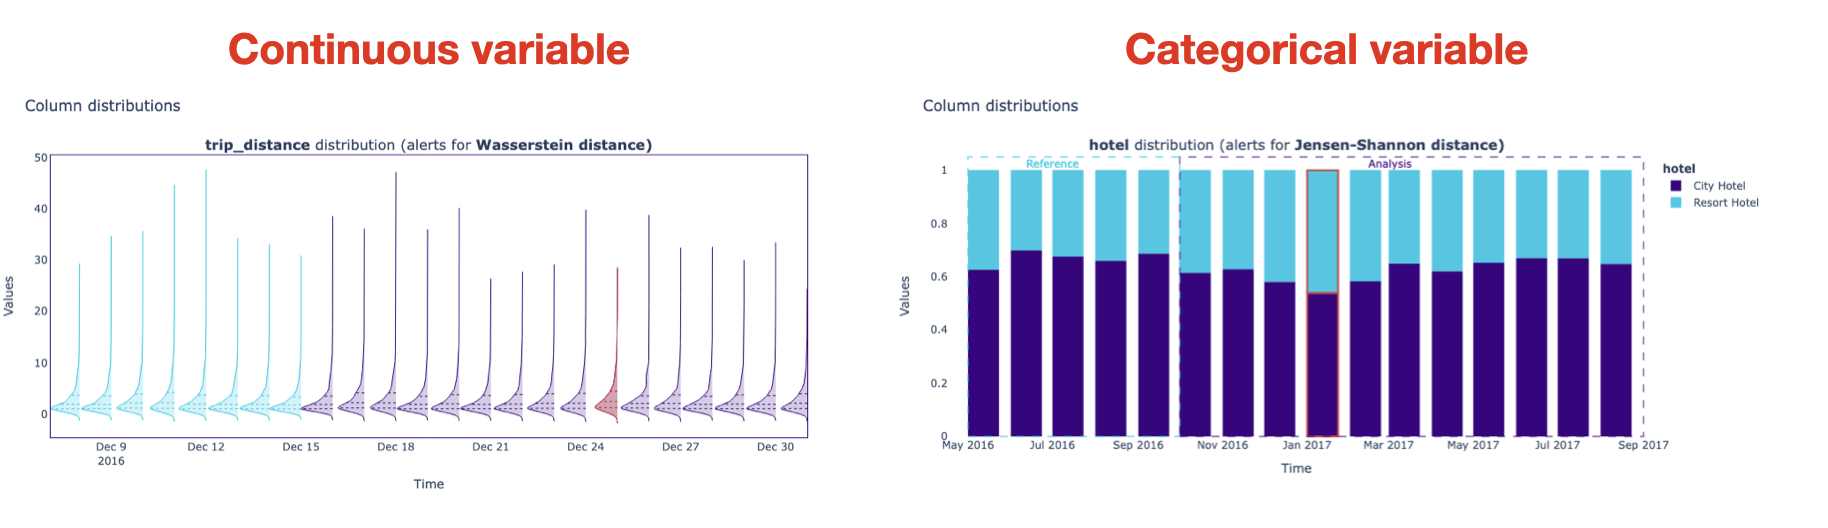
Hình hiển thị biểu đồ phân phối cho đặc trưng liên tục và phân loại.

Giám sát Machine Learning bằng Python

Ayo berlatih!

Giám sát Machine Learning bằng Python

Preparing Video For Download...