Phân tích Marketing: Dự đoán Khách hàng Rời bỏ bằng Python
Mark Peterson
Director of Data Science, Infoblox
Thư viện seaborn giúp bạn tạo biểu đồ trực quan, dễ hiểu
Xây dựng dựa trên matplotlib
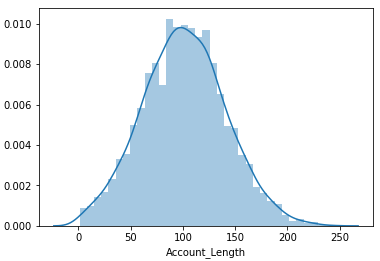
import matplotlib.pyplot as plt import seaborn as snssns.distplot(telco['Account_Length'])plt.show()

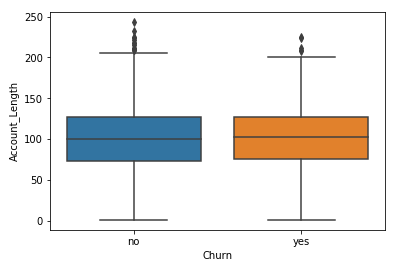
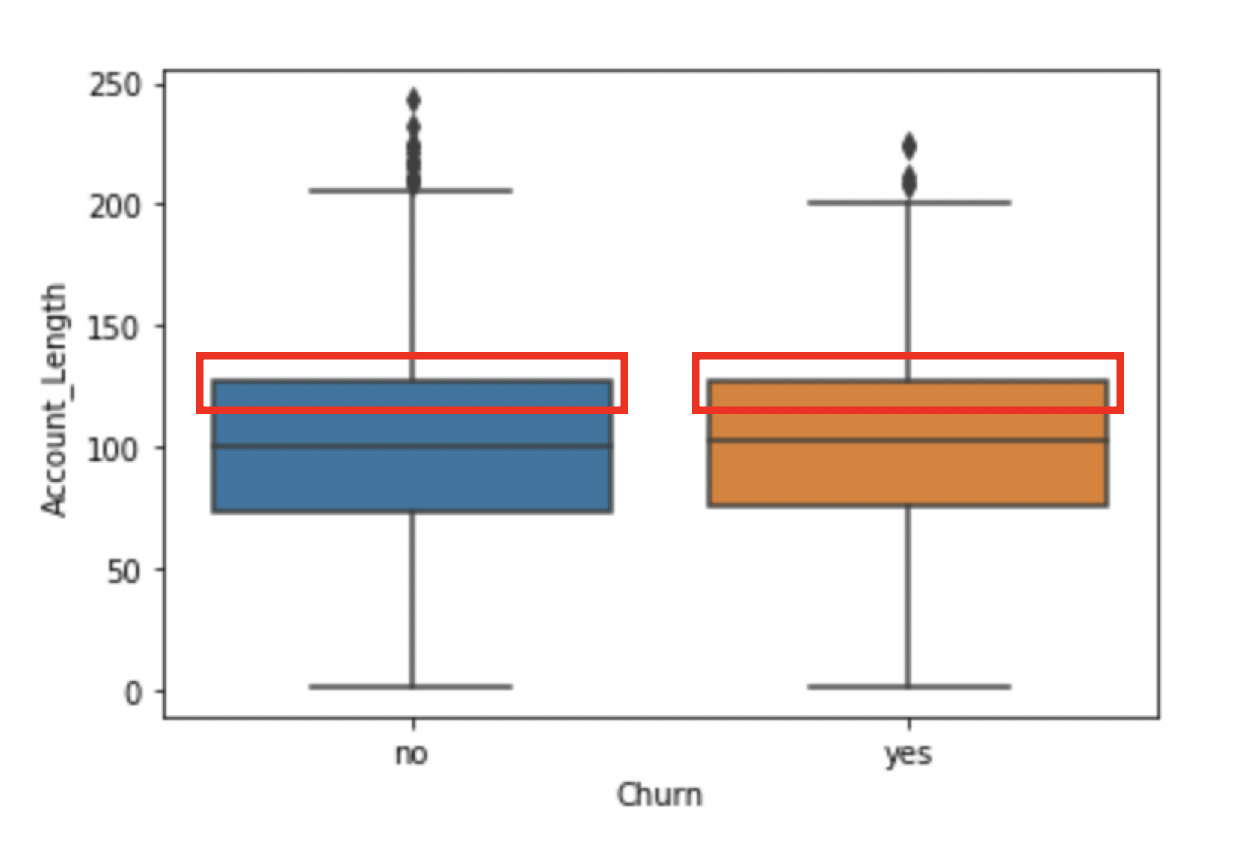
sns.boxplot(x = 'Churn',
y = 'Account_Length',
data = telco)
plt.show()

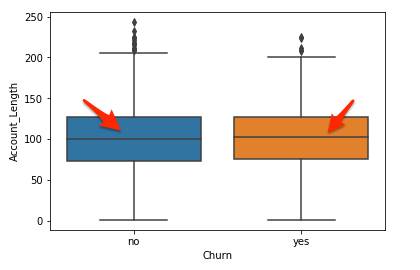
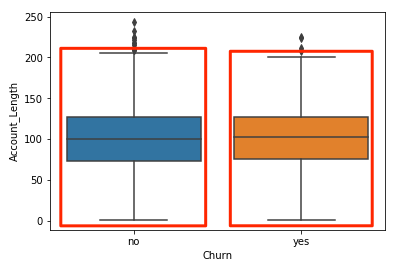
sns.boxplot(x = 'Churn',
y = 'Account_Length',
data = telco)
plt.show()

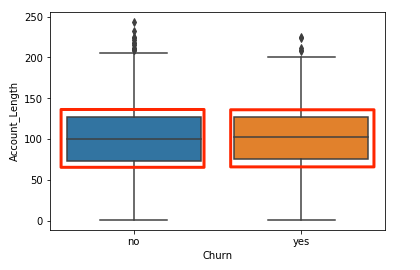
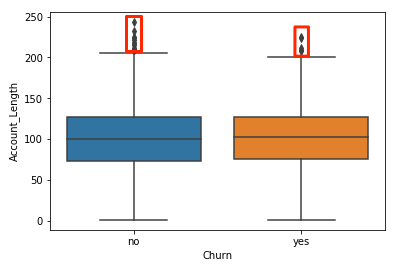
sns.boxplot(x = 'Churn',
y = 'Account_Length',
data = telco)
plt.show()

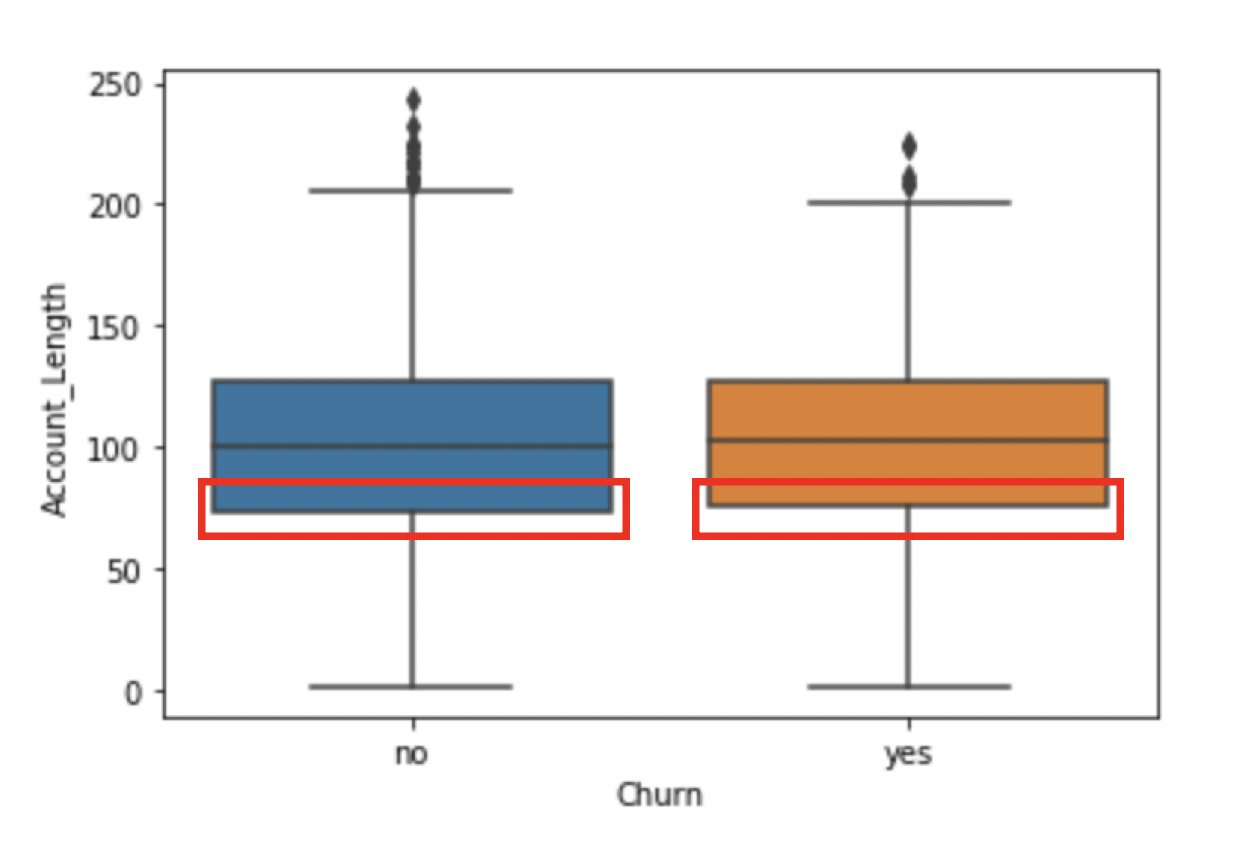
sns.boxplot(x = 'Churn',
y = 'Account_Length',
data = telco)
plt.show()

sns.boxplot(x = 'Churn',
y = 'Account_Length',
data = telco)
plt.show()

sns.boxplot(x = 'Churn',
y = 'Account_Length',
data = telco)
plt.show()

sns.boxplot(x = 'Churn',
y = 'Account_Length',
data = telco)
plt.show()

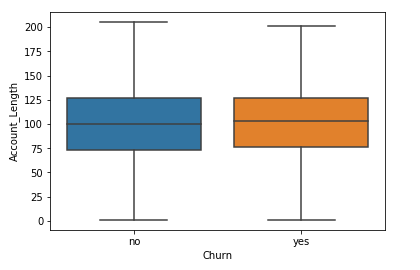
sns.boxplot(x = 'Churn',
y = 'Account_Length',
data = telco,
sym="")
plt.show()

sns.boxplot(x = 'Churn',
y = 'Account_Length',
data = telco,
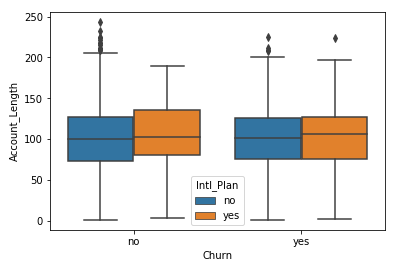
hue = 'Intl_Plan')
plt.show()

Phân tích Marketing: Dự đoán Khách hàng Rời bỏ bằng Python