Shinydashboard đầu tiên của bạn

Xây dựng Dashboard với shinydashboard

Png Kee Seng

Researcher

Những bước đã làm

  • Phác thảo giao diện (UI)
    • Header, sidebar, body
  • Định nghĩa outputs và cách chúng tương tác với inputs
  • Server đảm nhiệm vai trò này

bức vẽ

header <- dashboardHeader(...)
sidebar <- dashboardSidebar(...)
body <- dashboardBody(...)

ui <- dashboardPage(header, sidebar, body)
server <- function(input, output) { ... }
shinyApp(ui, server)
Xây dựng Dashboard với shinydashboard

Server

  • Cần định nghĩa outputs và inputs
  • Chỉ rõ outputs và cách chúng tương tác với inputs
  • Nên viết hàm trợ giúp để gọn và dễ đọc hơn
    • Đặt các hàm này ở đầu mã

Server giống một người bồi bàn hỗ trợ, truyền đạt yêu cầu của bạn tới bếp. Trong shinyApp, server cho R biết inputs tương tác với outputs như thế nào.

Xây dựng Dashboard với shinydashboard

Thêm biểu đồ

  • Quay lại dashboard giải bóng đá toàn cầu
  • Thêm biểu đồ hexbin cho đội 1
  • Sau đó đặt biểu đồ này trong server
  • Nếu muốn biểu đồ tương tự cho đội 2 thì sao?
soccer %>%
  ggplot(aes(x=`1_passes_compeletd`, 
             y=`1_goal_prevented`)) +
  geom_hex(bins=10) + theme_classic()
server <- function(input, output){
  output$plot1 <- renderPlot({
  fifa %>%
    ggplot(aes(x=`1_passes_compeletd`, 
               y=`1_goal_prevented`)) +
    geom_hex(bins=10) + theme_classic()
  })
}
Xây dựng Dashboard với shinydashboard

Định nghĩa đối tượng ggplot trong server

server <- function(input, output) {
  output$plot1 <- renderPlot({
    if (input$team == 1){

fifa %>% ggplot(aes(x=`1_passes_compeletd`, y=`1_goal_prevented`)) + geom_hex(bins=10) + theme_classic()
} else if (input$team == 2){
fifa %>% ggplot(aes(x=`2_passes_compeletd`, y=`2_goal_prevented`)) + geom_hex(bins=10) + theme_classic()
} }) }
Xây dựng Dashboard với shinydashboard

Dùng hàm trợ giúp

plot_hex <- function(team){
  if (team == 1){
    soccer %>% ggplot(aes(x=`1_passes_compeletd`, 
                        y=`1_goal_prevented`)) +
      geom_hex(bins=10) + theme_classic()
  }
  else if (team == 2){
    soccer %>% ggplot(aes(x=`2_passes_compeletd`, 
                        y=`2_goal_prevented`)) +
      geom_hex(bins=10) + theme_classic()
  }
}
Xây dựng Dashboard với shinydashboard

Dùng hàm trợ giúp

Với hàm trợ giúp

server <- function(input, output) {
  output$plot1 <- renderPlot(plot_hex(input$team)) 
}
  • Có dễ đọc hơn không?

Không dùng hàm trợ giúp

server <- function(input, output) {
  output$plot1 <- renderPlot({
    if (input$team == 1){
      soccer %>% ggplot(aes(x=`1_passes_compeletd`, 
              y=`1_goal_prevented`)) +
        geom_hex(bins=10) + theme_classic()
      }
    else if (input$team == 2){
      soccer %>% ggplot(aes(x=`2_passes_compeletd`, 
              y=`2_goal_prevented`)) +
        geom_hex(bins=10) + theme_classic()
      }
    })
}
Xây dựng Dashboard với shinydashboard

Ghép tất cả lại

# Một shinydashboard hoàn chỉnh

header <- dashboardHeader(title = "Giải bóng đá")
sidebar <- dashboardSidebar(sidebarMenu(menuItem("Chuyền/bàn thắng", tabName = "passtab"), menuItem("Trống", tabName = "emptytab")))
body <- dashboardBody(tabItems( tabItem("passtab", fluidRow(box(selectInput("team", "Số đội", choices = c(1,2))), box(plotOutput("plot1"))) ), tabItem("emptytab")) )
ui <- dashboardPage(header, sidebar, body)
server <- function(input, output) { output$plot1 <- renderPlot(plot_hex(input$team)) }
shinyApp(ui, server)
Xây dựng Dashboard với shinydashboard

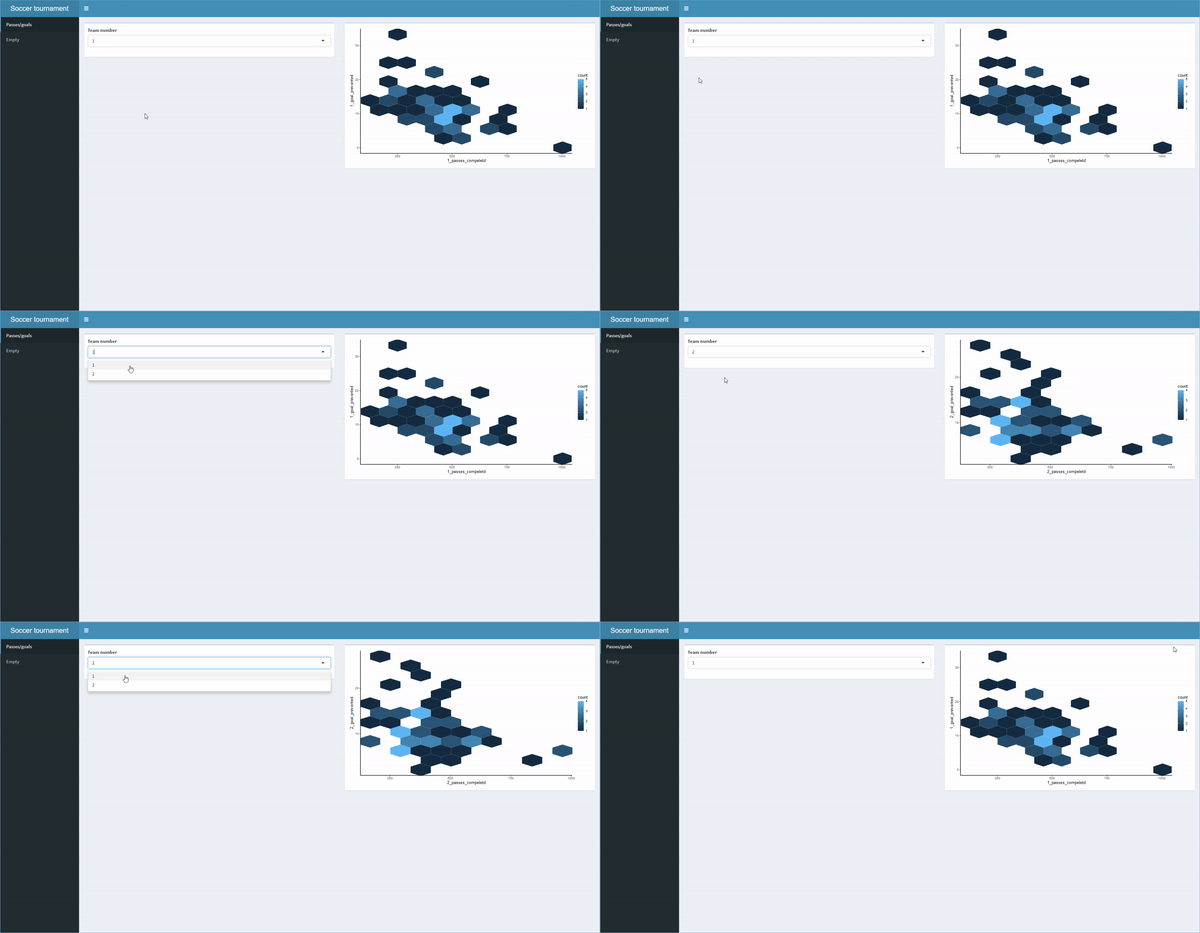
Hoạt ảnh cho thấy shinydashboard sau khi render: người dùng có thể chuyển giữa các trang/thẻ và nhập dữ liệu để nhận đầu ra khác nhau.

Xây dựng Dashboard với shinydashboard

Ayo berlatih!

Xây dựng Dashboard với shinydashboard

Preparing Video For Download...