Các loại output

Xây dựng Dashboard với shinydashboard

Png Kee Seng

Researcher

Hàm output và render

  • Trong shinyApp sẽ có các output
  • Mỗi output cần một cặp hàm

    • Thứ nhất là hàm trong UI
    • Dùng để xác định vị trí đặt output
    • Hàm output thường có dạng:
      <type>output(<identifying label>, ...)
      
  • Mã thứ hai được định nghĩa trong hàm server

    • Có dạng:
      output$<identifying label> <- render<type>(...)
      
Xây dựng Dashboard với shinydashboard

Ví dụ: Nghiên cứu giấc ngủ

  • Trước hết, nhập dữ liệu
    library(tidyverse)
    sleep <- read_csv("../data/Time Americans Spend Sleeping.csv")  
    
  • Các cột như sau
    $ index                   : num [1:945] 0 1 2 3 4  ...
    $ Year                    : num [1:945] 2003 2004 2005 2006 2007 ...
    $ Period                  : chr [1:945] "Annual" "Annual" "Annual" "Annual" ...
    $ Avg hrs per day sleeping: num [1:945] 8.57 8.55 8.62 8.63  ...
    $ Standard Error          : num [1:945] 0.018 0.026 0.023 0.024  ...
    $ Type of Days            : chr [1:945] "All days" "All days" "All days" ...
    $ Age Group               : chr [1:945] "15 years and over" "15 years and over" ...
    $ Activity                : chr [1:945] "Sleeping" "Sleeping" "Sleeping" ...
    $ Sex                     : chr [1:945] "Both" "Both" "Both" ...
    
Xây dựng Dashboard với shinydashboard

textOutput

  • Đầu tiên đặt textOutput trong UI
ui <- fluidPage(
  titlePanel("Sleeping habits in America"), 
  textOutput("textlabel"))

server <- function(input, output) {
}

shinyApp(ui, server)
Xây dựng Dashboard với shinydashboard

renderText

  • Để render văn bản, đặt renderText trong server
  • Cần dùng ký hiệu output$
ui <- fluidPage(
  titlePanel("Sleeping habits in America"), 
  textOutput("textlabel"))

server <- function(input, output) { output$textlabel <- renderText("Sleep deprivation is a serious health issue in many major cities around the world.") }
shinyApp(ui, server)
Xây dựng Dashboard với shinydashboard

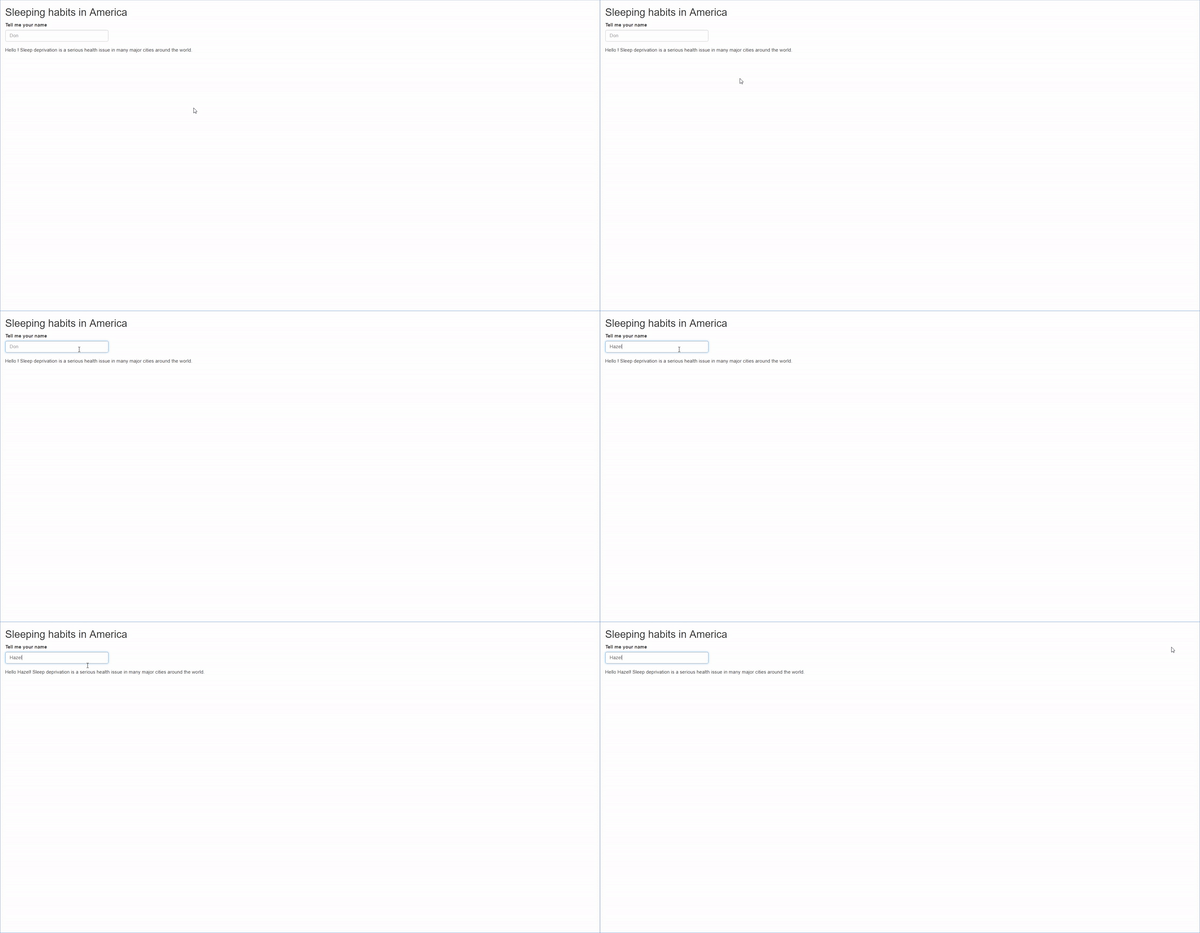
textOutput đã render

minh họa text output không có tương tác input.

Xây dựng Dashboard với shinydashboard

textOutput với tương tác

  • Để cho phép tương tác giữa input và output, ta phải gọi input bằng input$
input$<type>
Xây dựng Dashboard với shinydashboard

textOutput với tương tác

  • Ví dụ, xét một text input.
ui <- fluidPage(
  titlePanel("Sleeping habits in America"), 

textInput("textlabel", "Tell me your name", value = "", placeholder = "Don"),
textOutput("textoutlabel")) server <- function(input, output) { output$textoutlabel <- renderText(paste0("Hello ",
input$textlabel,
"Sleep deprivation is a serious health issue in many major cities around the world.")) } shinyApp(ui, server)
Xây dựng Dashboard với shinydashboard

textOutput với tương tác

đầu ra văn bản có tương tác.

Xây dựng Dashboard với shinydashboard

plotOutput

  • Đặt plotOutput() trong UI
ui <- fluidPage(
  titlePanel("Sleeping habits in America"), 

plotOutput("plotlabel"))
server <- function(input, output) { } shinyApp(ui, server)
Xây dựng Dashboard với shinydashboard

renderPlot

  • Cần đặt renderPlot() trong server()
ui <- fluidPage(
  titlePanel("Sleeping habits in America"), 
  plotOutput("plotlabel"))

server <- function(input, output) {

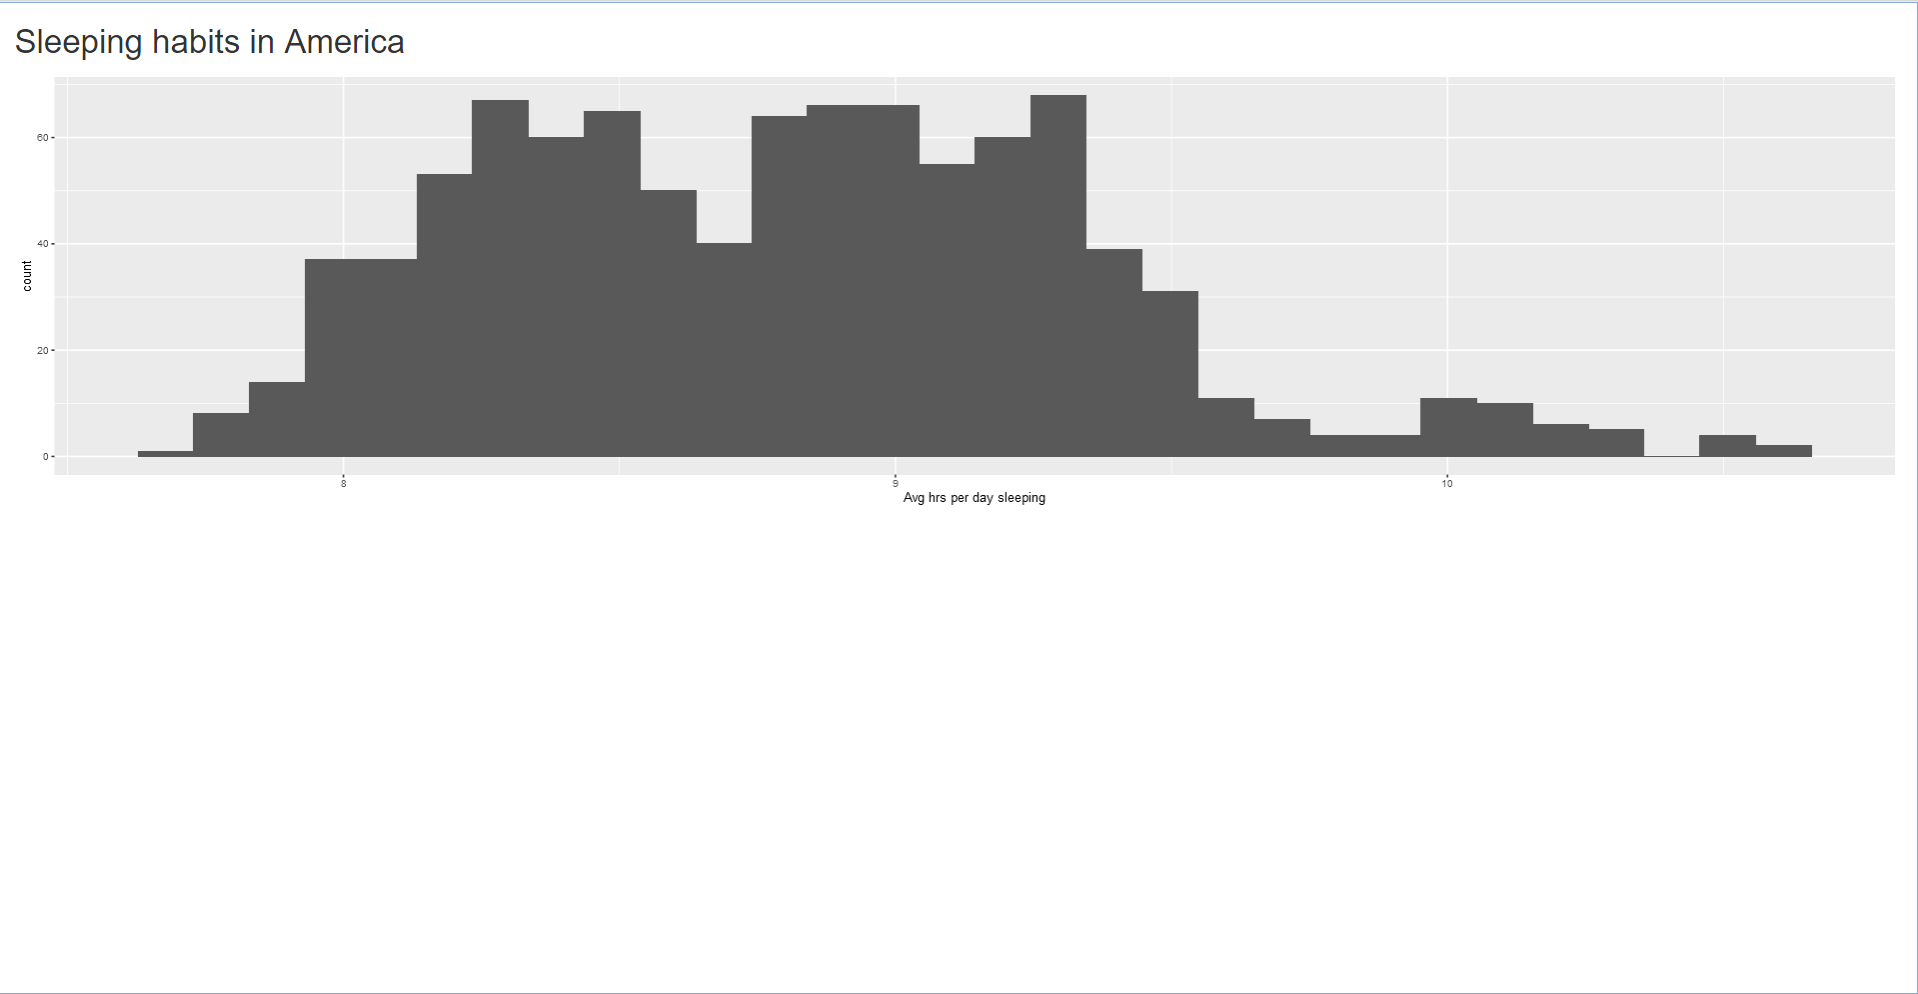
output$plotlabel <- renderPlot({ ggplot(sleep) + geom_histogram(aes(x = `Avg hrs per day sleeping`)) })
} shinyApp(ui, server)
Xây dựng Dashboard với shinydashboard

plotOutput đã render

minh họa plotoutput.

Xây dựng Dashboard với shinydashboard

plotOutput với selectInput

  • Dùng user input để tạo kết quả khác nhau
ui <- fluidPage(
  titlePanel("Sleeping habits in America"), 
  selectInput("selectlabel", 
              "Select an option",
              choices = c("Histogram", "Boxplot")),
  plotOutput("plotlabel"))
Xây dựng Dashboard với shinydashboard

plotOutput với selectInput

server <- function(input, output) {
  output$plotlabel <- renderPlot({
    if (input$selectlabel == "Histogram"){

ggplot(sleep) + geom_histogram(aes(x = `Avg hrs per day sleeping`))
} else if (input$selectlabel == "Boxplot"){
ggplot(sleep) + geom_boxplot(aes(x = `Avg hrs per day sleeping`))
} }) } shinyApp(ui, server)
Xây dựng Dashboard với shinydashboard

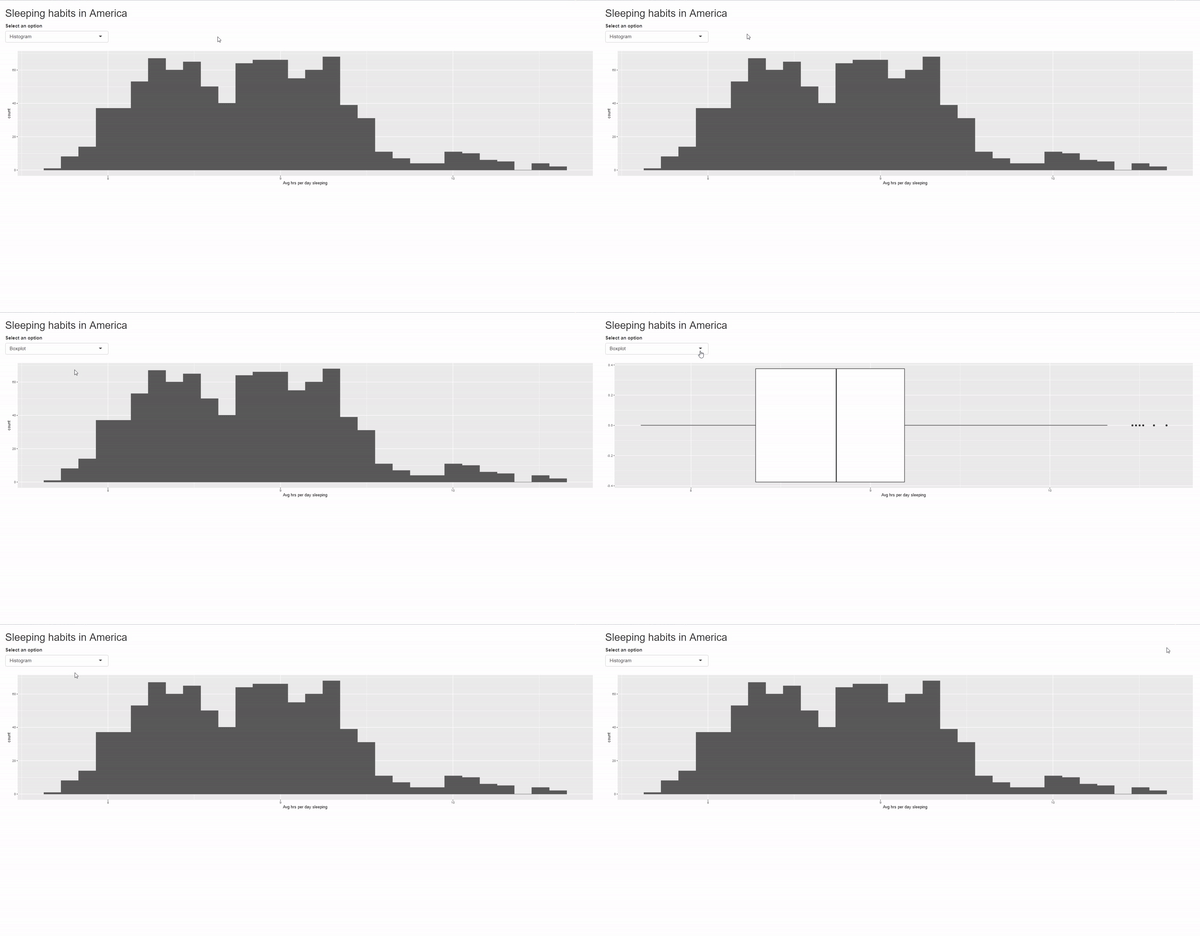
plotOutput với selectInput

Minh họa plotOutput với selectInput

Xây dựng Dashboard với shinydashboard

plotOutput với sliderInput

  • Xét ví dụ khác với sliderInput
ui <- fluidPage(
  titlePanel("Sleeping habits in America"), 

sliderInput("sliderlabel", "Average hours of sleep", min = 7.5, max = 11, value = c(7.5, 11), step = 0.02),
plotOutput("plotlabel")) server <- function(input, output) {
output$plotlabel <- renderPlot({ filter(sleep, `Avg hrs per day sleeping` >= input$sliderlabel[1], `Avg hrs per day sleeping` <= input$sliderlabel[2]) %>% ggplot() + geom_boxplot(aes(x=`Avg hrs per day sleeping`)) })
} shinyApp(ui, server)
Xây dựng Dashboard với shinydashboard

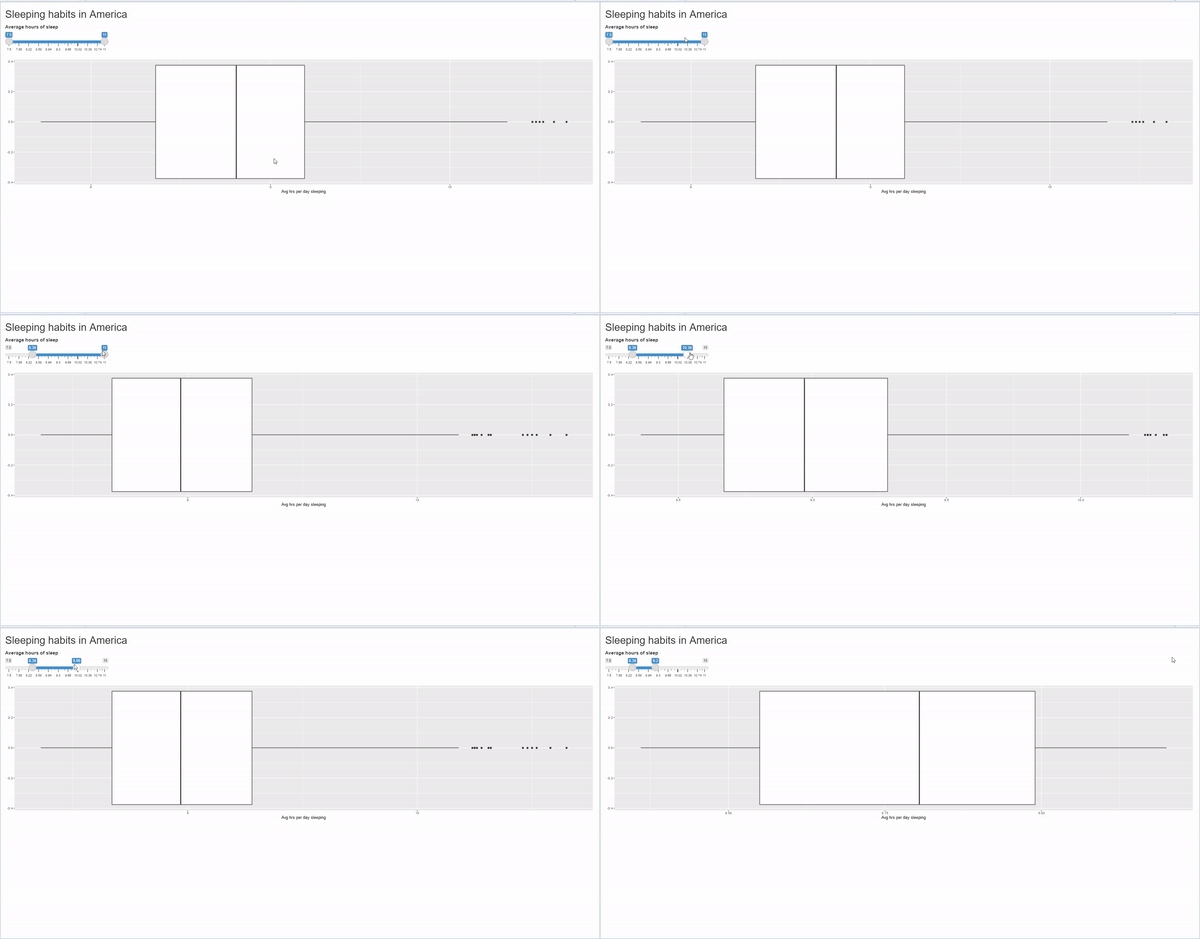
plotOutput với sliderInput

Minh họa plotoutput với sliderinput

Xây dựng Dashboard với shinydashboard

Biểu tượng trong shiny

  • shiny cũng có các biểu tượng dùng trong shinyApp
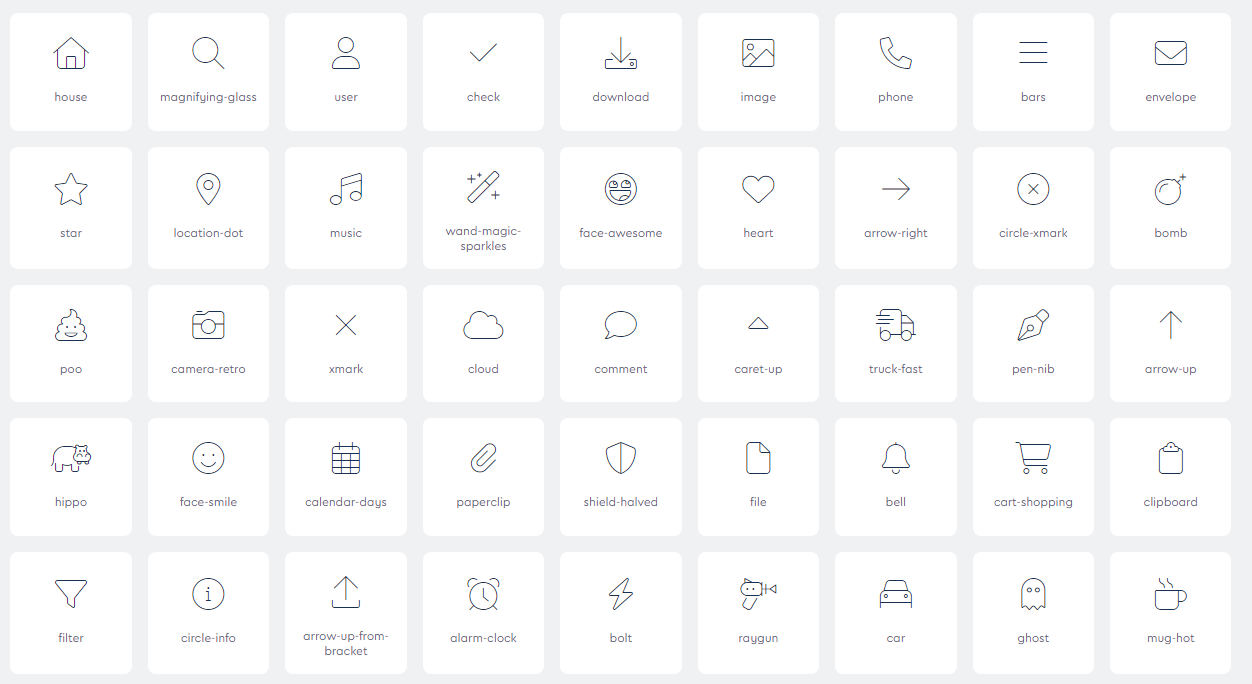
Một số biểu tượng trong shiny

1 https://fontawesome.com/icons
Xây dựng Dashboard với shinydashboard

Biểu tượng trong shiny: Ví dụ

  • Dùng icon("...")
  • Nhắc lại ví dụ trước
  • Ví dụ: icon("bed")
ui <- fluidPage(
  titlePanel("Sleeping habits in America"), 
  sliderInput("sliderlabel",

list(icon("bed"),
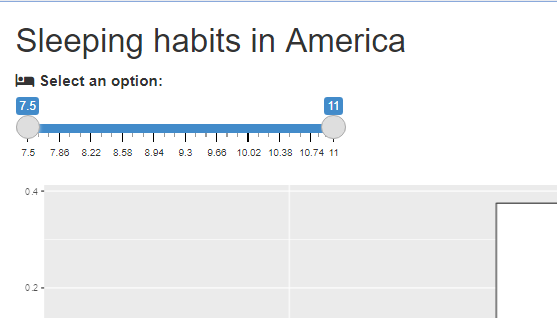
"Select an option:"), min = 7.5, max = 11, value = c(7.5, 11), step = 0.02), plotOutput("plotlabel")) server <- function(input, output) { output$plotlabel <- renderPlot({ filter(sleep, `Avg hrs per day sleeping` >= input$sliderlabel[1], `Avg hrs per day sleeping` <= input$sliderlabel[2]) %>% ggplot() + geom_boxplot(aes(x=`Avg hrs per day sleeping`)) }) } shinyApp(ui, server)
Xây dựng Dashboard với shinydashboard

Ứng dụng đã render với biểu tượng

Minh họa biểu tượng

Xây dựng Dashboard với shinydashboard

Ayo berlatih!

Xây dựng Dashboard với shinydashboard

Preparing Video For Download...