Simulation-based Inference

Suy luận cho hồi quy tuyến tính trong R

Jo Hardin

Professor, Pomona College
Suy luận cho hồi quy tuyến tính trong R

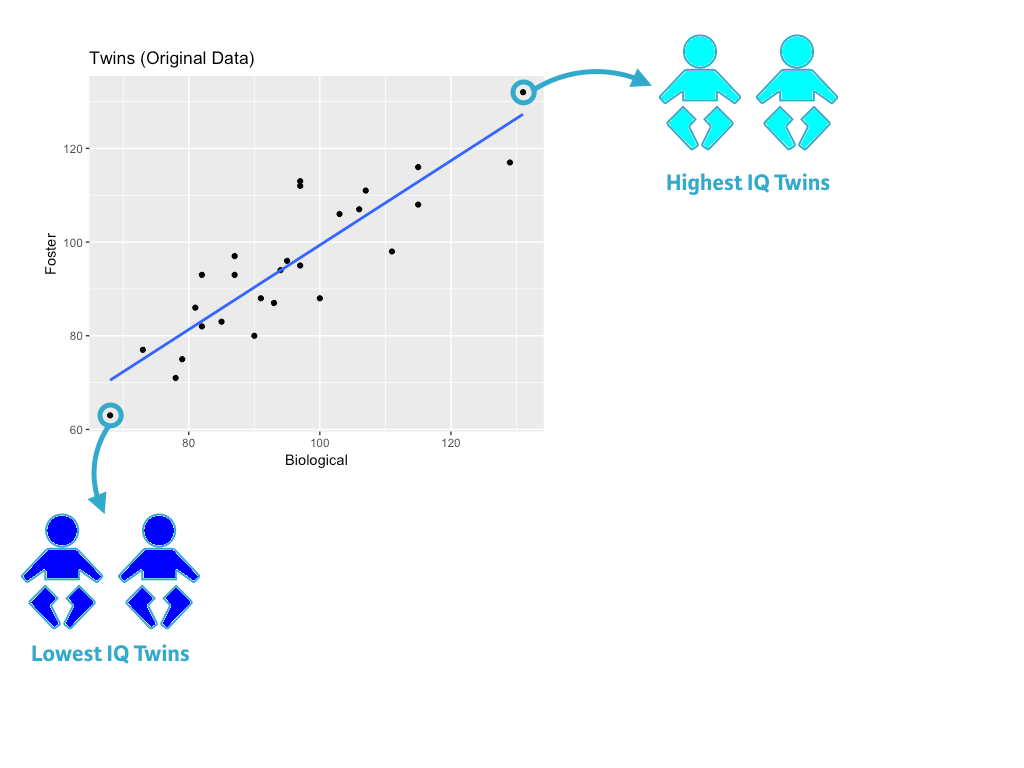
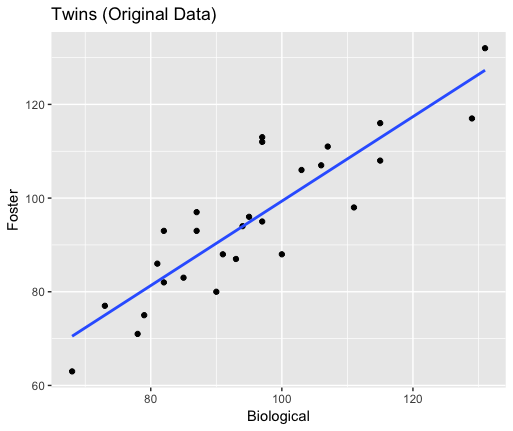
A scatter plot of twins' IQS.

Suy luận cho hồi quy tuyến tính trong R

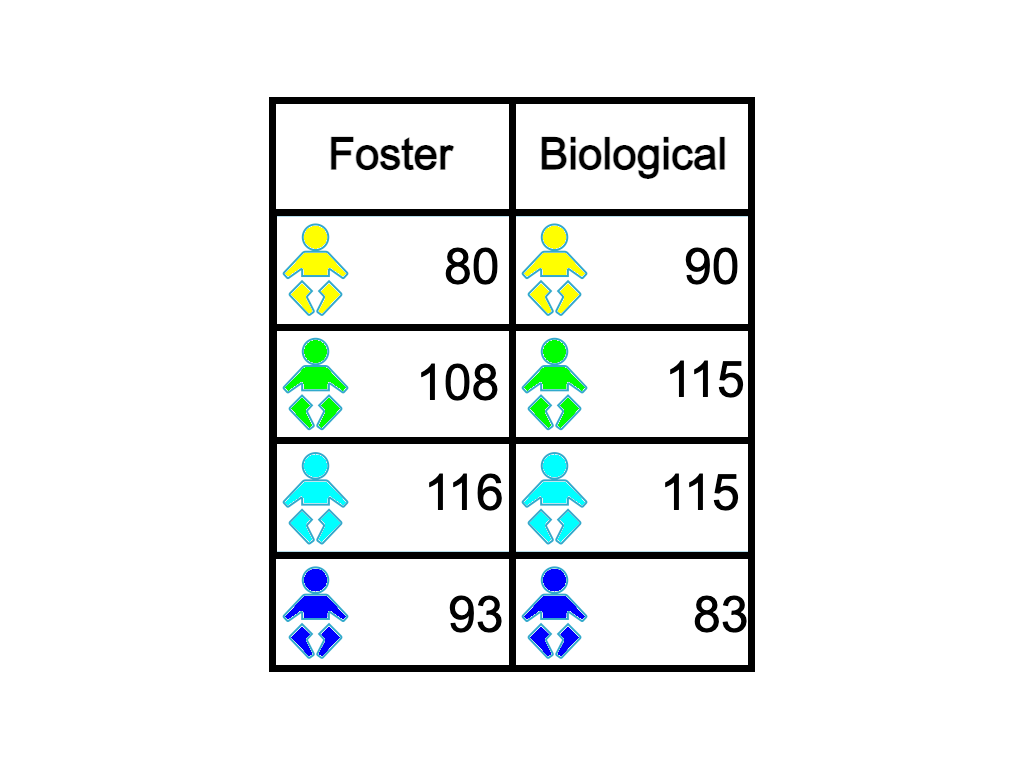
Twin data

A table of twins IQs. Each row corresponds to a pair of twins. The first column contains the IQ of the twin raised by foster parents, and the second column contains the IQ of the twin raised by biological parents.

Suy luận cho hồi quy tuyến tính trong R

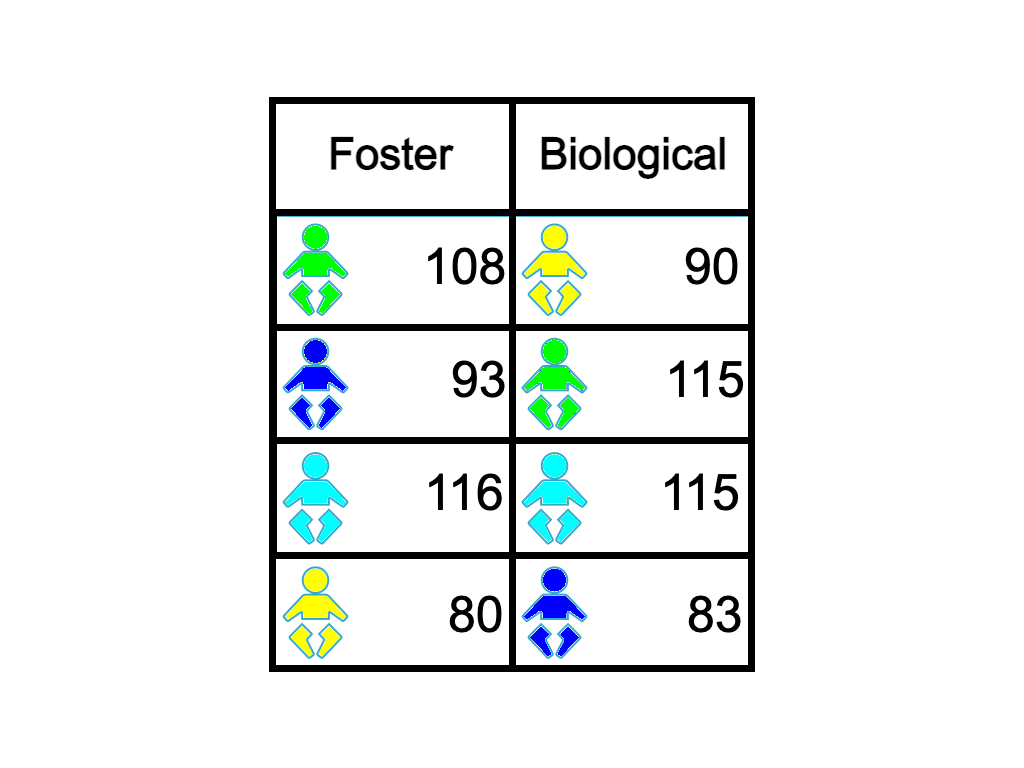
Permuted twin data

The table of twins IQs has had each column permuted, so that pairs of twins no longer appear together on the same row.

Suy luận cho hồi quy tuyến tính trong R

Permuted data (1) plotted

Original data
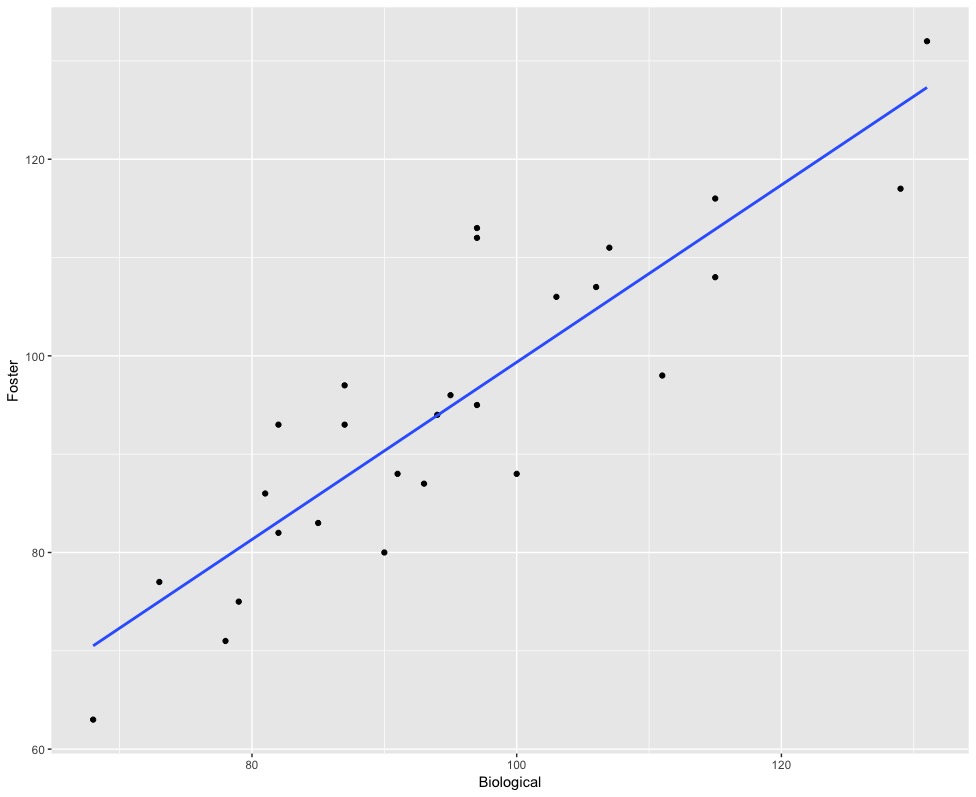
Permuted data (1)
Suy luận cho hồi quy tuyến tính trong R

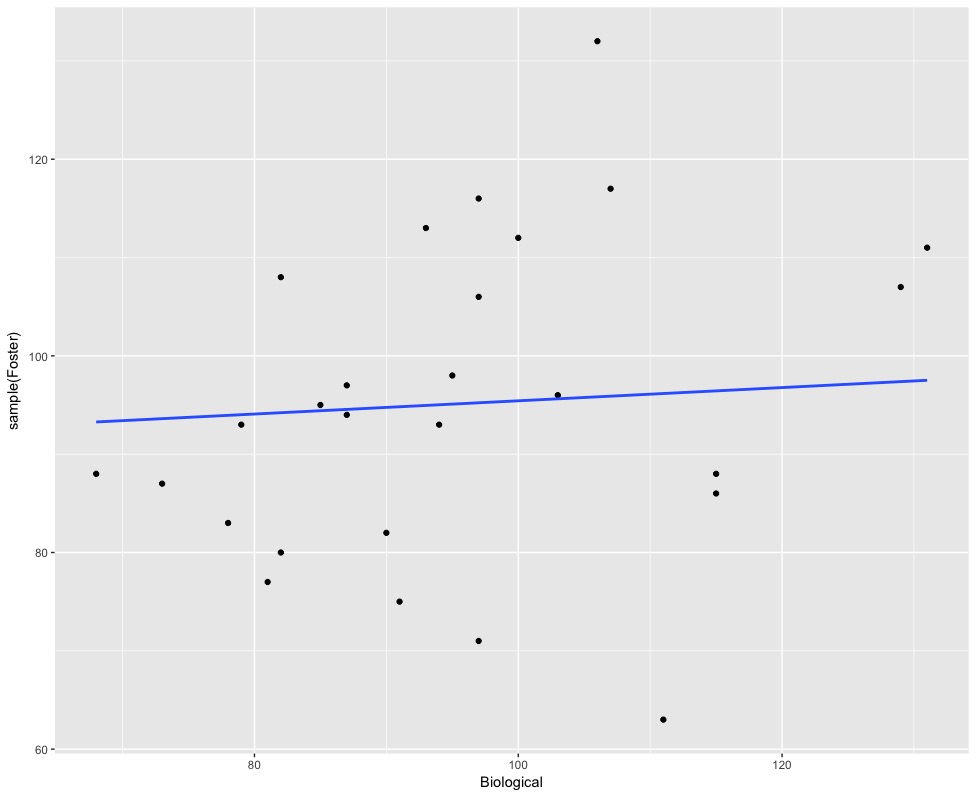
Permuted data (2) plotted

Original data

Permuted data (2)
Suy luận cho hồi quy tuyến tính trong R

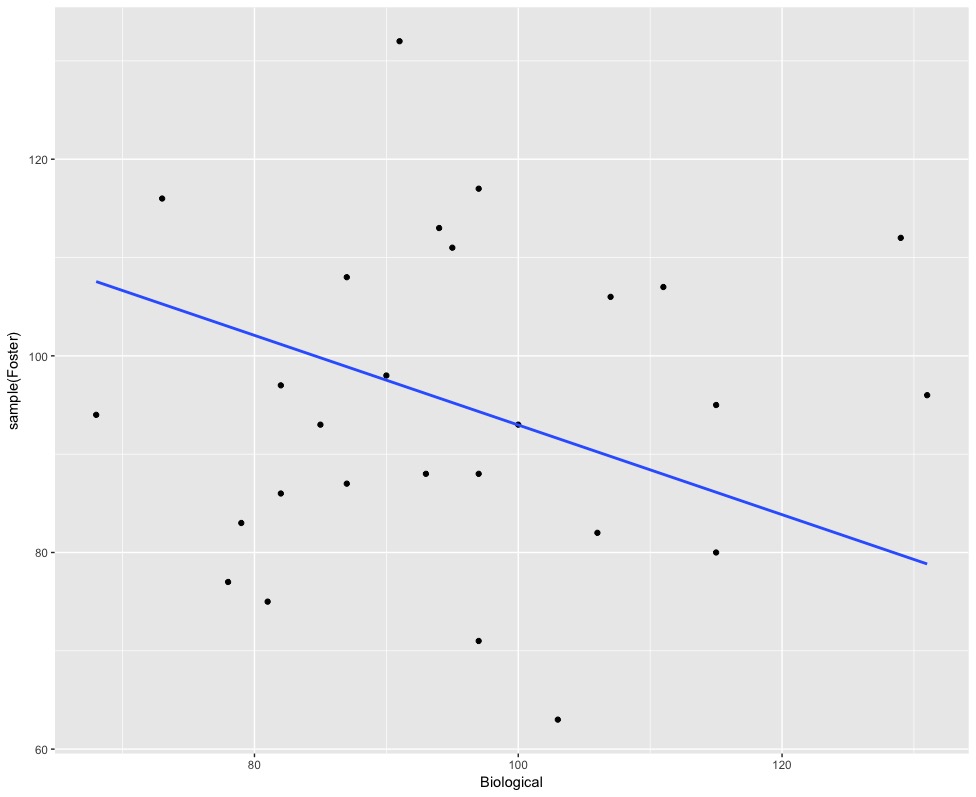
Permuted data (1) and (2)

Permuted data (1)

Permuted data (2)

Suy luận cho hồi quy tuyến tính trong R
twins %>%
   specify(Foster ~ Biological) %>%
   hypothesize(null = "independence") %>%
   generate(reps = 10, type = "permute") %>%
   calculate(stat = "slope")
A tibble: 10 x 2
   replicate          stat
       <int>         <dbl>
 1         1  0.0007709302
 2         2 -0.0353592305
 3         3 -0.0278627974
 4         4 -0.0072547982
 5         5 -0.1252761541
 6         6 -0.1669869287
 7         7 -0.2610519170
 8         8 -0.0157695494
 9         9  0.0581361900
10        10  0.1598471947
Suy luận cho hồi quy tuyến tính trong R

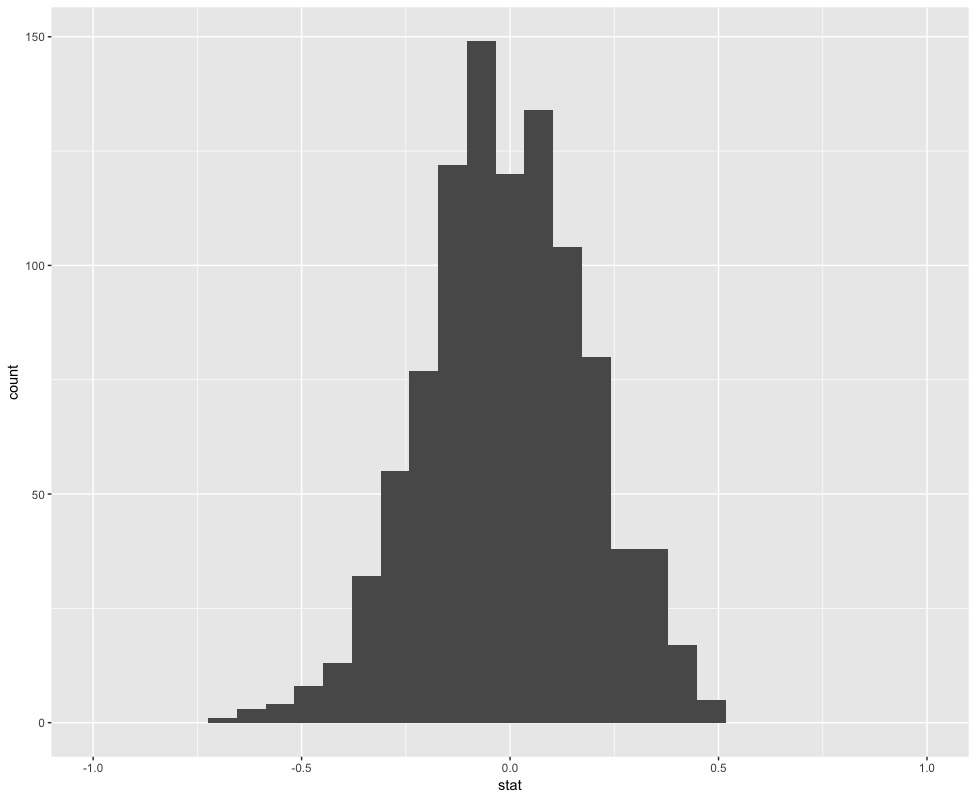
Many permuted slopes

perm_slope <- twins %>%
   specify(Foster ~ Biological) %>%
   hypothesize(
     null = "independence"
     ) %>%
   generate(reps = 1000, 
            type = "permute") %>%
   calculate(stat = "slope") 

ggplot(data = perm_slope, aes(x = stat)) + 
   geom_histogram() +
   xlim(-1,1)

Suy luận cho hồi quy tuyến tính trong R

Permuted slopes with observed slope in red
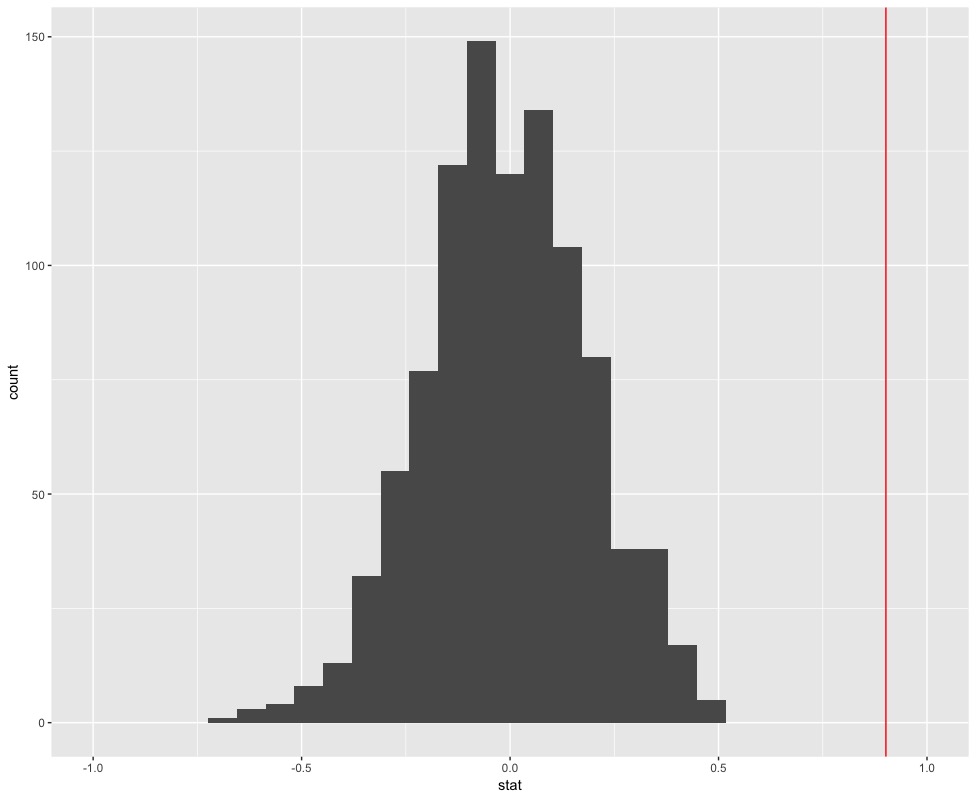
obs_slope <- lm(Foster ~ Biological,
                data = twins) %>%
   tidy() %>%   
   filter(term == "Biological") %>%
   select(estimate) %>%   
   pull()
obs_slope
0.901436
ggplot(data = perm_slope, aes(x = stat)) + 
   geom_histogram() +
   geom_vline(xintercept = obs_slope, color = "red") 
   + xlim(-1,1)

Suy luận cho hồi quy tuyến tính trong R

Let's practice!

Suy luận cho hồi quy tuyến tính trong R

Preparing Video For Download...