Cách trực quan hóa hoạt động trong Python
Python dành cho người dùng bảng tính

Chris Cardillo
Data Scientist
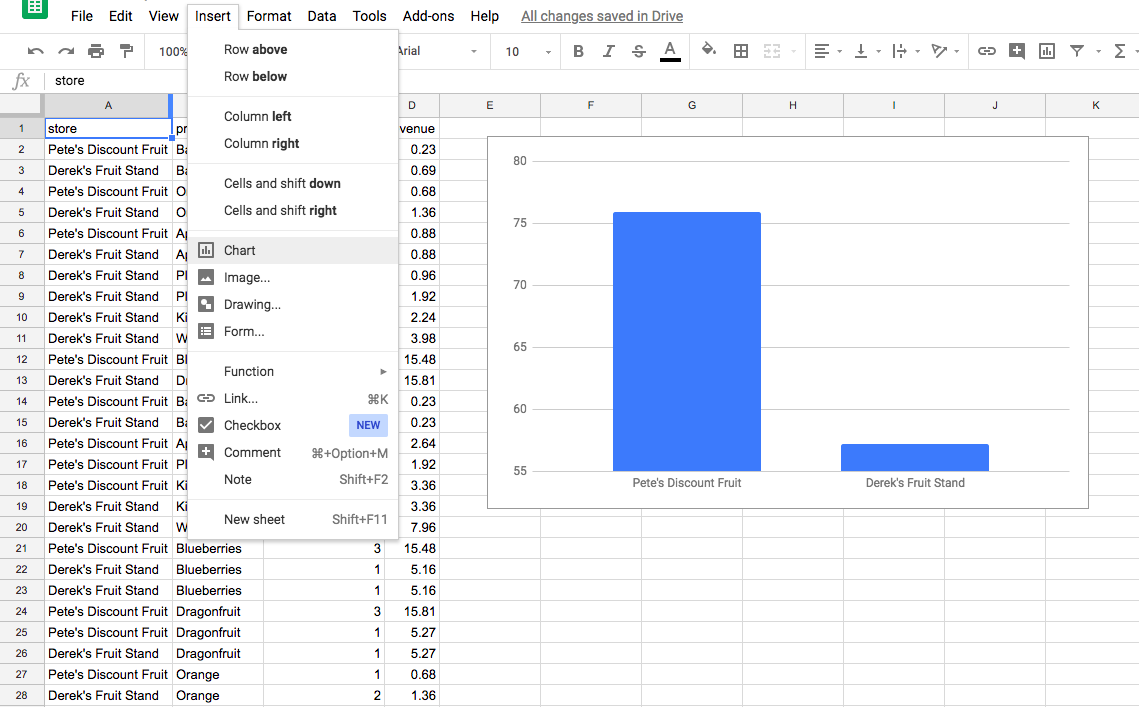
Biểu đồ bảng tính
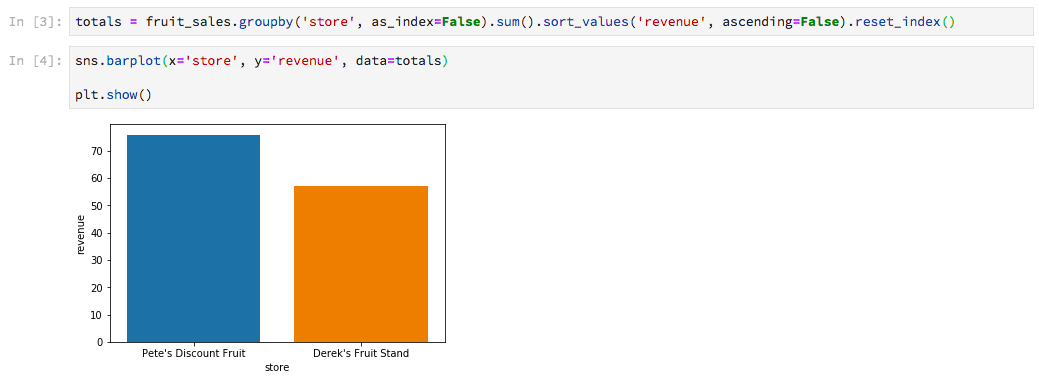
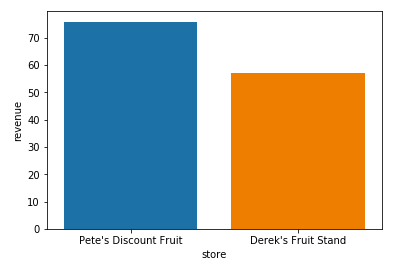
Biểu đồ Python
plt.show()
sns.barplot(x='store', y='revenue', data=totals)

plt.show()
Python dành cho người dùng bảng tính
Chris Cardillo
Data Scientist
sns.barplot(x='store', y='revenue', data=totals)
plt.show()

