How long might you be stopped for a violation?

Phân tích hoạt động của cảnh sát với pandas

Kevin Markham

Founder, Data School

Analyzing an object column

apple
date_and_time         price    volume  change      
2018-01-08 16:00:00  174.35  20567800    down
...                     ...       ...     ...
2018-03-09 16:00:00  179.98  32185200      up
  • Create a Boolean column: True if the price went up, and False otherwise
  • Calculate how often the price went up by taking the column mean
apple.change.dtype
dtype('O')
  • .astype() can't be used in this case
Phân tích hoạt động của cảnh sát với pandas

Mapping one set of values to another

  • Dictionary maps the values you have to the values you want
mapping = {'up':True, 'down':False}

apple['is_up'] = apple.change.map(mapping)
apple
date_and_time         price    volume change  is_up
2018-01-08 16:00:00  174.35  20567800   down  False
...                     ...       ...    ...    ...
2018-03-09 16:00:00  179.98  32185200     up   True
apple.is_up.mean()
0.5
Phân tích hoạt động của cảnh sát với pandas

Calculating the search rate

  • Visualize how often searches were done after each violation type
ri.groupby('violation').search_conducted.mean()
violation
Equipment              0.064280
Moving violation       0.057014
Other                  0.045362
Registration/plates    0.093438
Seat belt              0.031513
Speeding               0.021560
search_rate = ri.groupby('violation').search_conducted.mean()
Phân tích hoạt động của cảnh sát với pandas

Creating a bar plot

search_rate.plot(kind='bar')
plt.show()
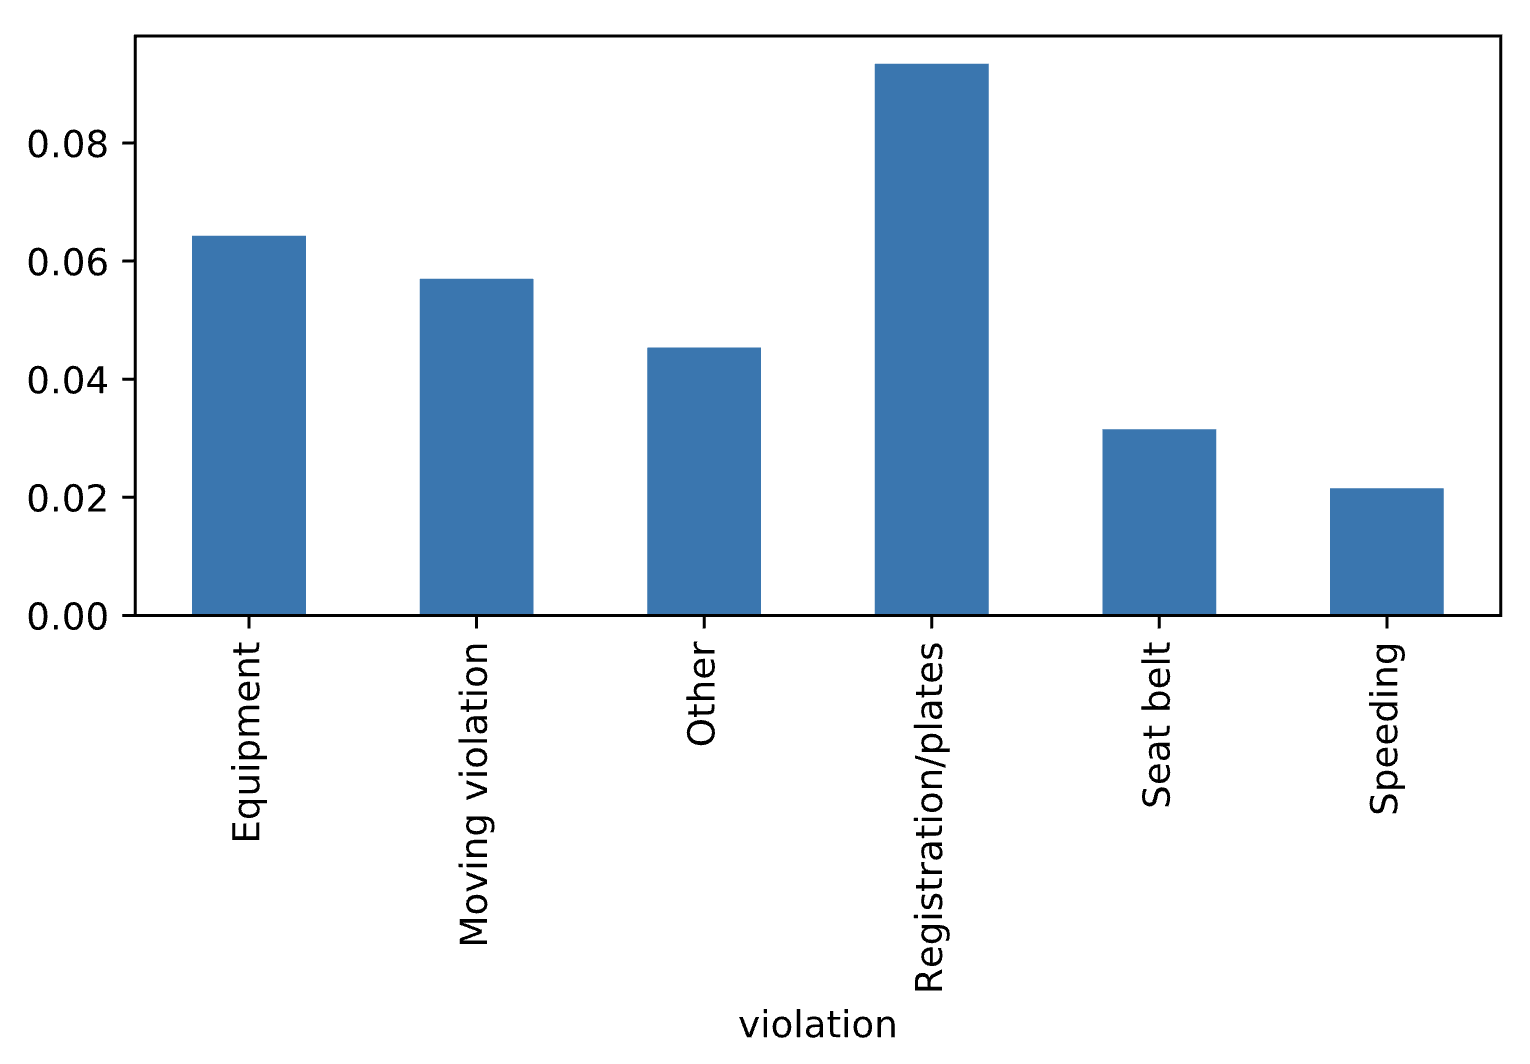
Bar plot of search rate by violation

Phân tích hoạt động của cảnh sát với pandas

Ordering the bars (1)

  • Order the bars from left to right by size
search_rate.sort_values()
violation
Speeding               0.021560
Seat belt              0.031513
Other                  0.045362
Moving violation       0.057014
Equipment              0.064280
Registration/plates    0.093438
Name: search_conducted, dtype: float64
Phân tích hoạt động của cảnh sát với pandas

Ordering the bars (2)

search_rate.sort_values().plot(kind='bar')
plt.show()
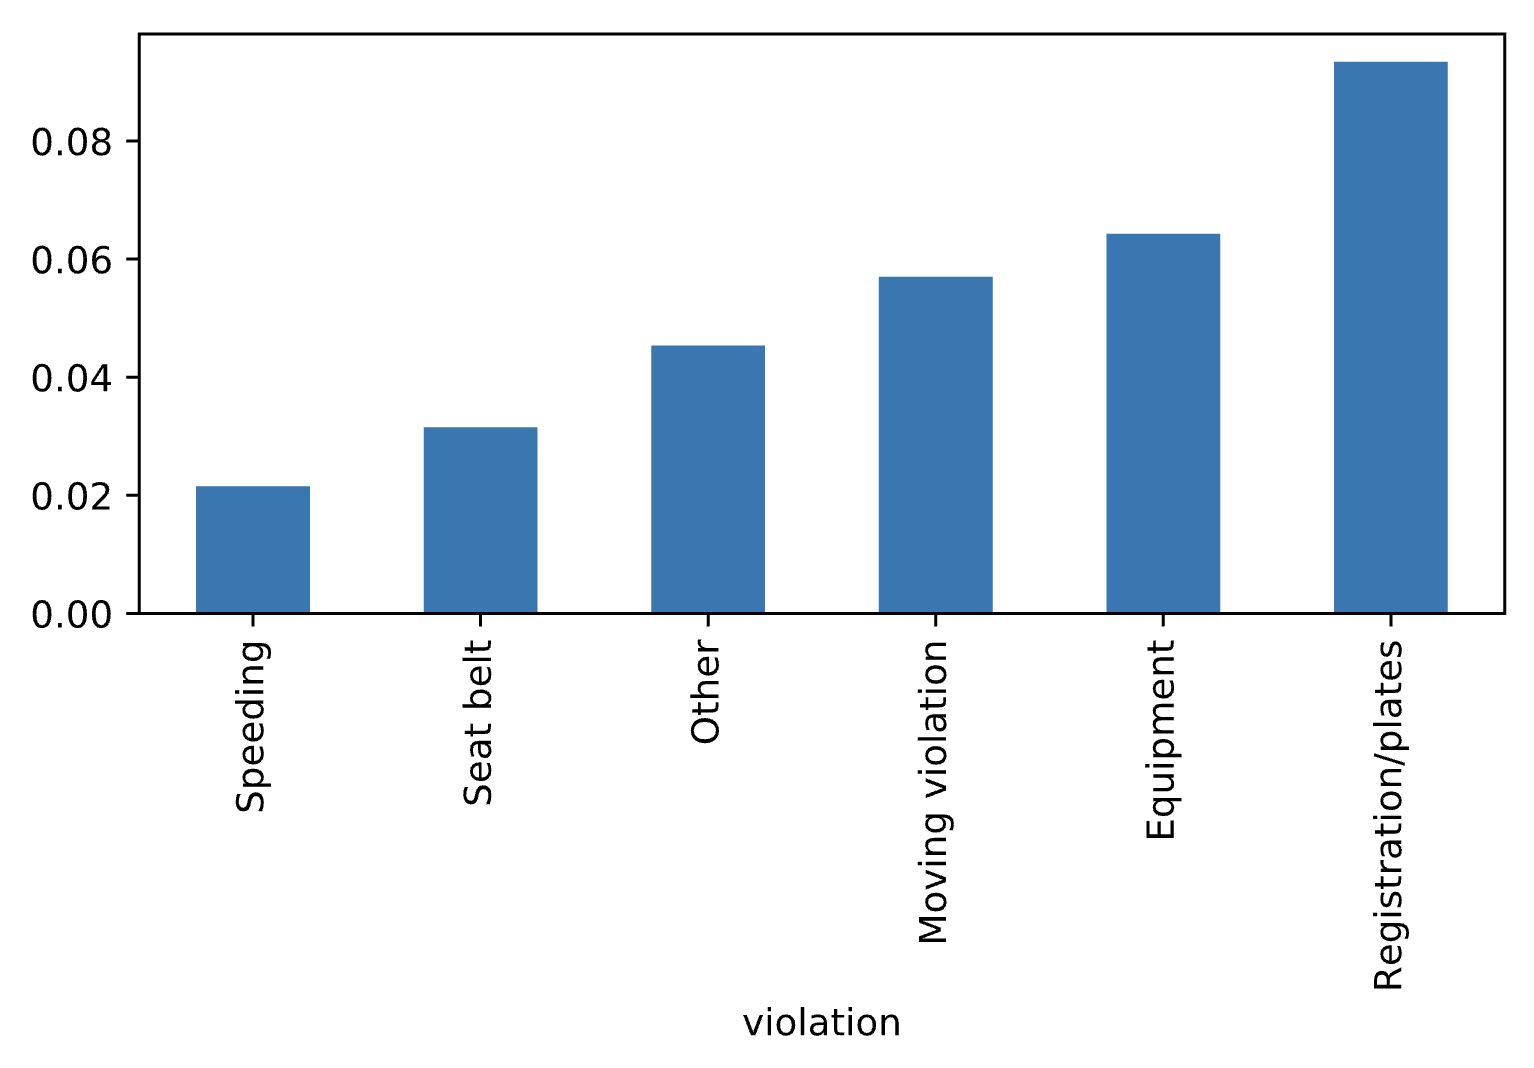
Ordered bar plot of search rate by violation

Phân tích hoạt động của cảnh sát với pandas

Rotating the bars

search_rate.sort_values().plot(kind='barh')
plt.show()
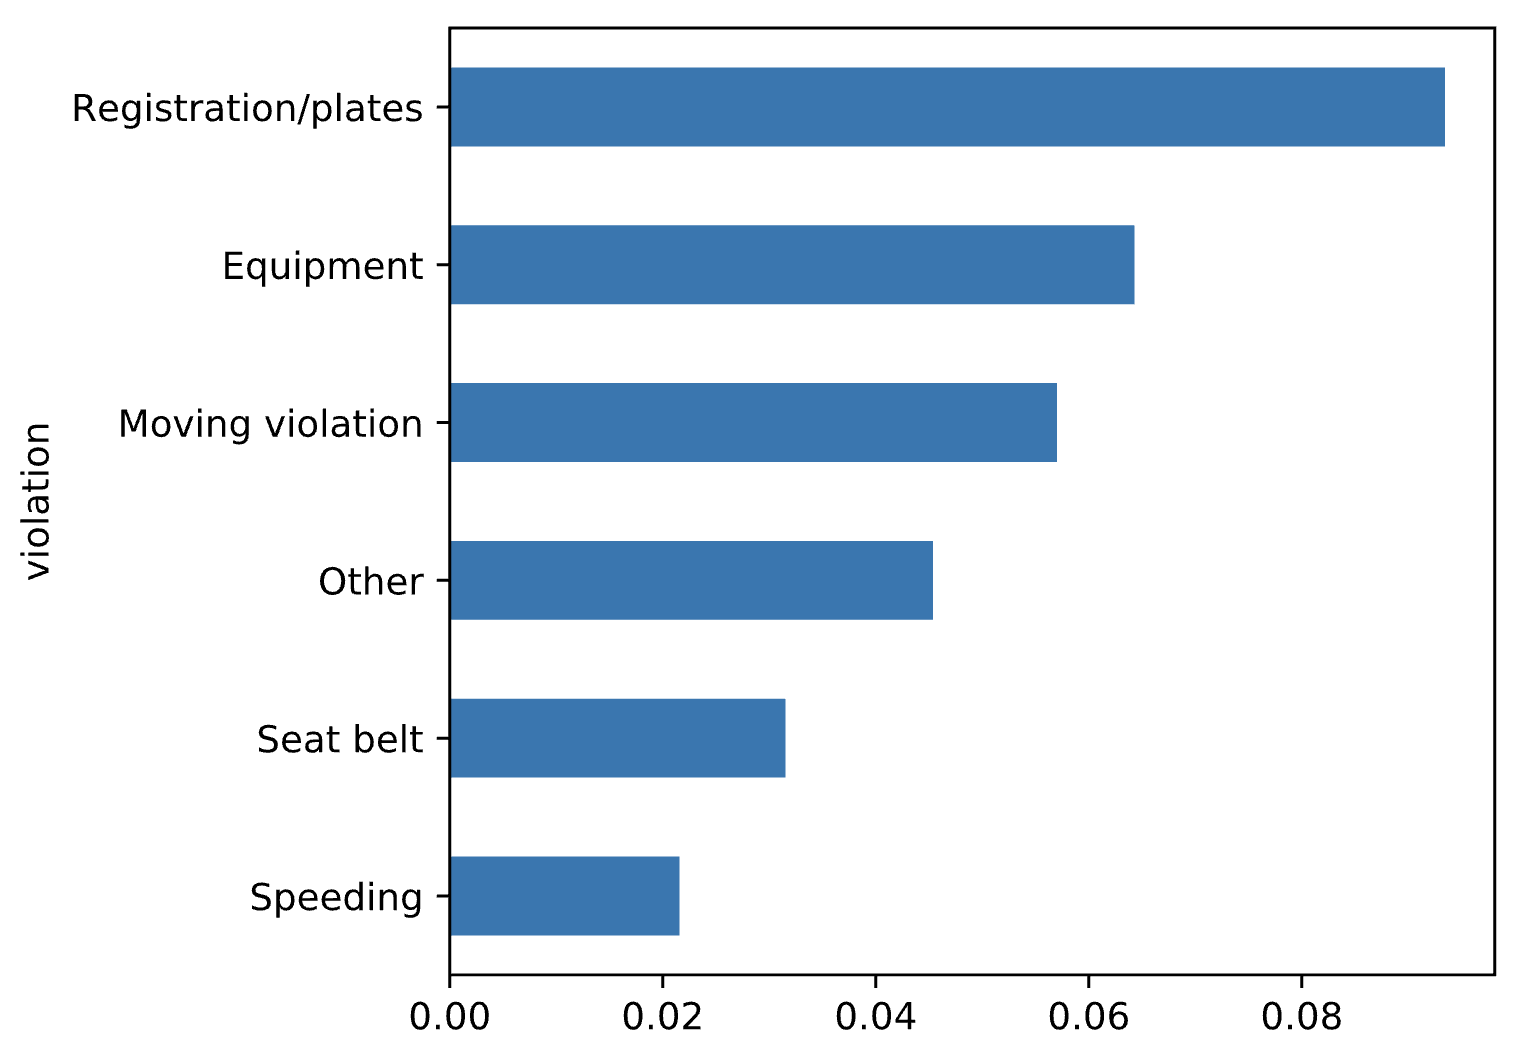
Horizontal bar plot of search rate by violation

Phân tích hoạt động của cảnh sát với pandas

Let's practice!

Phân tích hoạt động của cảnh sát với pandas

Preparing Video For Download...