Trực quan hóa tỷ số cho phân tích trong công ty
Phân tích báo cáo tài chính bằng Python

Rohan Chatterjee
Risk modeler
Trực quan hóa các tỷ số tài chính
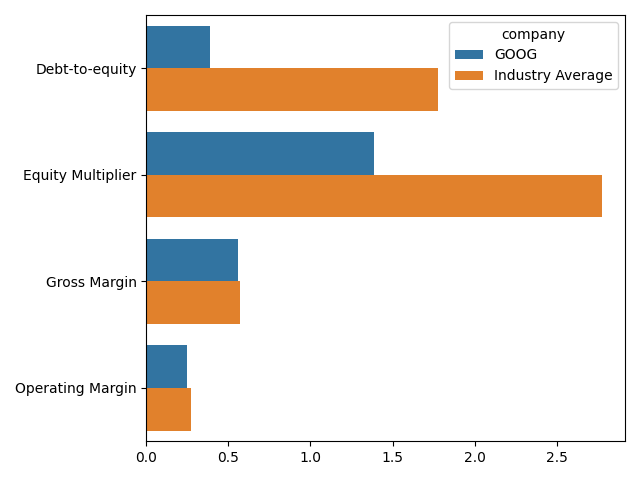
- Biểu đồ cột hữu ích để
- trực quan hóa tỷ số tài chính trung bình của một công ty, và
- đánh giá hiệu suất so với trung bình ngành
Chuẩn bị dữ liệu để vẽ
- Dùng
pivot_tableđể tính trung bình tỷ số theo công ty:avg_company_ratio = plot_dat.pivot_table(index=["comp_type", "company"], values=["Gross Margin", "Operating Margin", "Debt-to-equity", "Equity Multiplier"], aggfunc="mean").reset_index() print(avg_company_ratio.head())

Chuẩn bị dữ liệu để vẽ
- Dùng
pivot_tableđể tính trung bình tỷ số theo ngành:avg_industry_ratio = plot_dat.pivot_table(index="comp_type", values=["Gross Margin", "Operating Margin", "Debt-to-equity", "Equity Multiplier"], aggfunc="mean").reset_index() print(avg_industry_ratio.head())

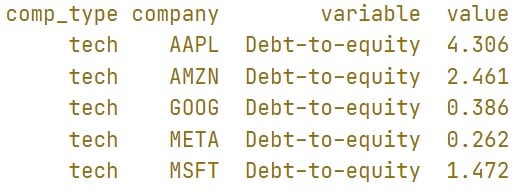
print(molten_plot_company.head())
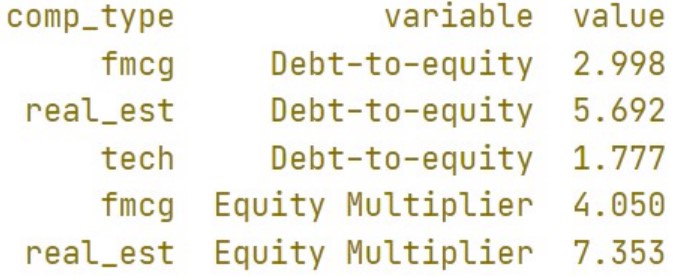
print(molten_plot_industry.head())
Vẽ biểu đồ cột
sns.barplot(data=molten_plot, y="variable", x="value", hue="company", ci=None)
plt.xlabel(""), plt.ylabel("")
plt.show()

