Phân tích sống sót bằng Python
Shae Wang
Senior Data Scientist

from lifelines import WeibullFitter
from lifelines import ExponentialFitter
from lifelines import LogNormalFitter
from lifelines import LogLogisticFitter
from lifelines import GeneralizedGammaFitter
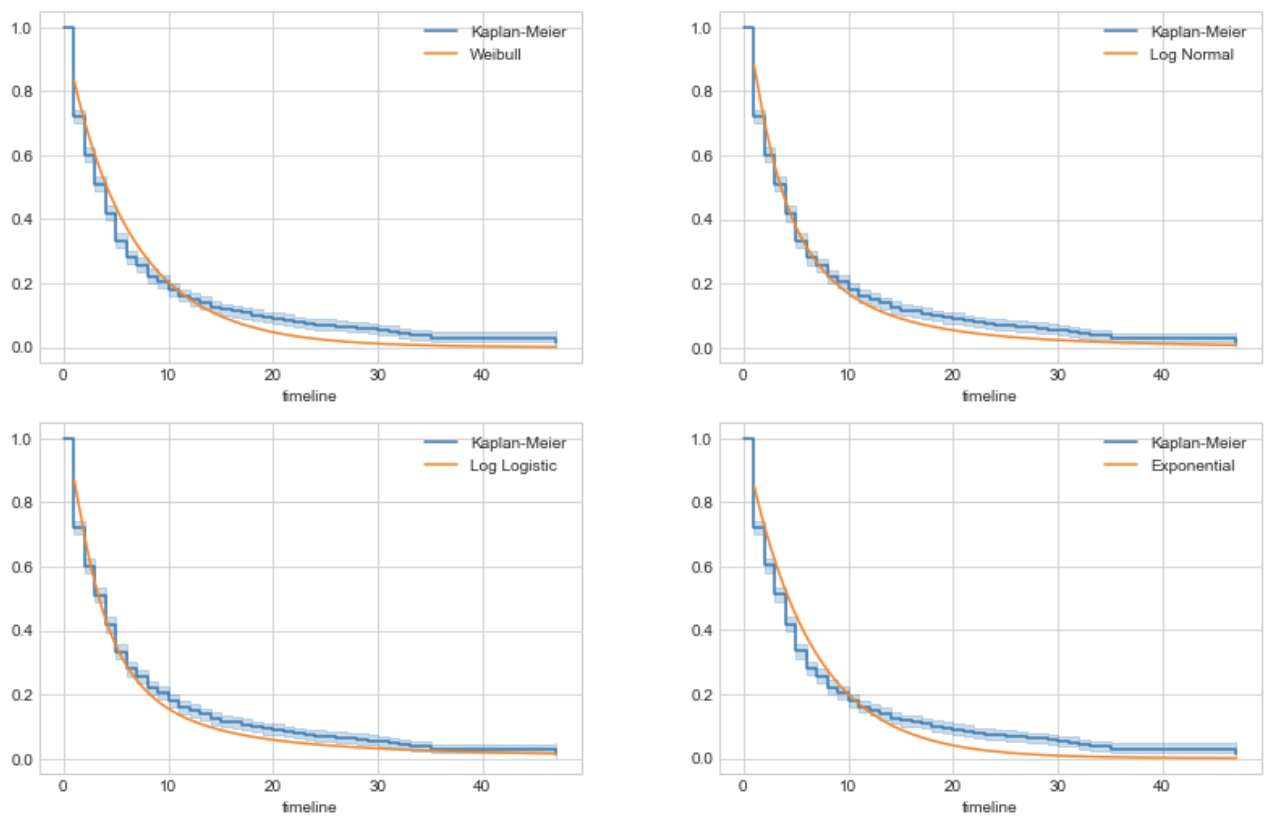
Bước 1) Khớp mô hình tham số trong lifelines
Bước 2) In và so sánh thuộc tính AIC_ của từng mô hình
Bước 3) Ưu tiên giá trị AIC nhỏ nhất
from lifelines import WeibullFitter,
ExponentialFitter,
LogNormalFitter
wb = WeibullFitter().fit(D, E)
exp = ExponentialFitter().fit(D, E)
log = LogNormalFitter().fit(D, E)
print(wb.AIC_, exp.AIC_, log.AIC_)
215.9091 216.1183 202.3498
find_best_parametric_model(): hàm tích hợp của lifelines để tự động so sánh AIC giữa các mô hình tham số.lifelines.Cách dùng
T: thời lượng, E: kiểm duyệtbest_model, best_aic_ = find_best_parametric_model(event_times=T,
event_observed=E,
scoring_method="AIC")
print(best_model)
<lifelines.WeibullFitter:"Weibull_estimate",
được khớp với 686 quan sát tổng, 387 quan sát bị kiểm duyệt phải>
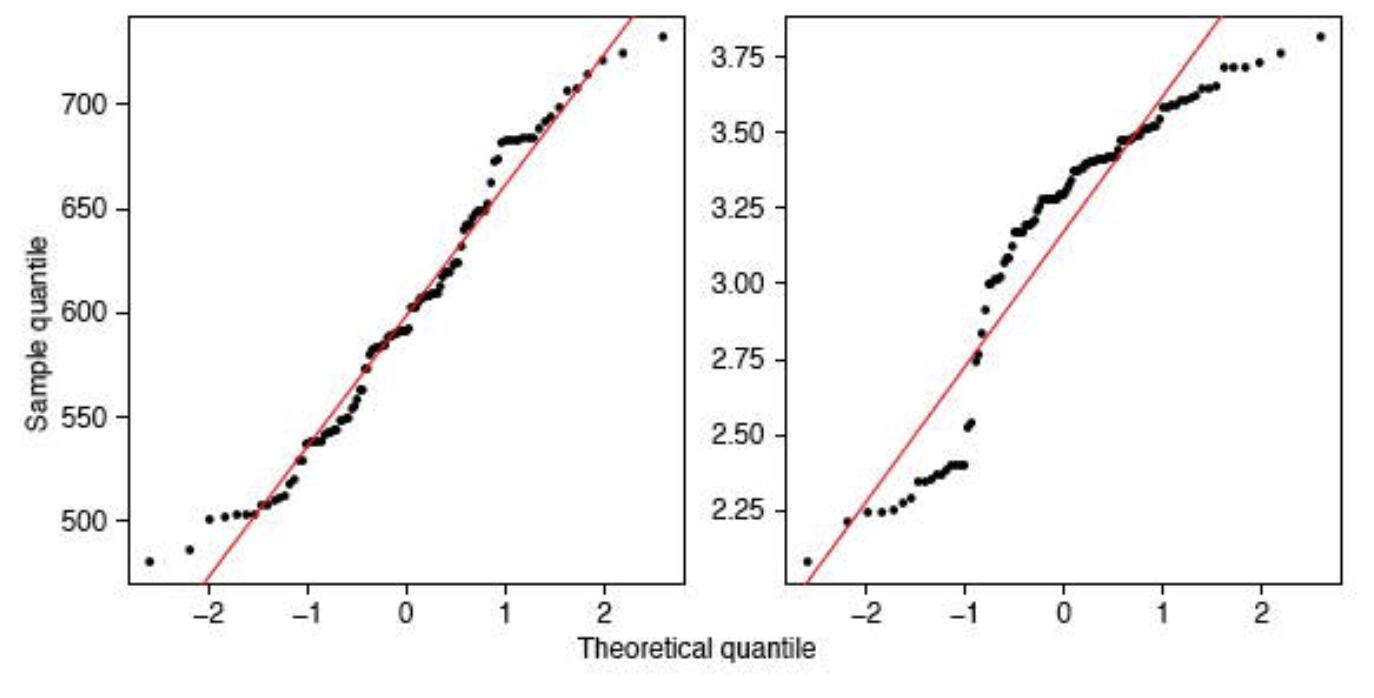
y = x.
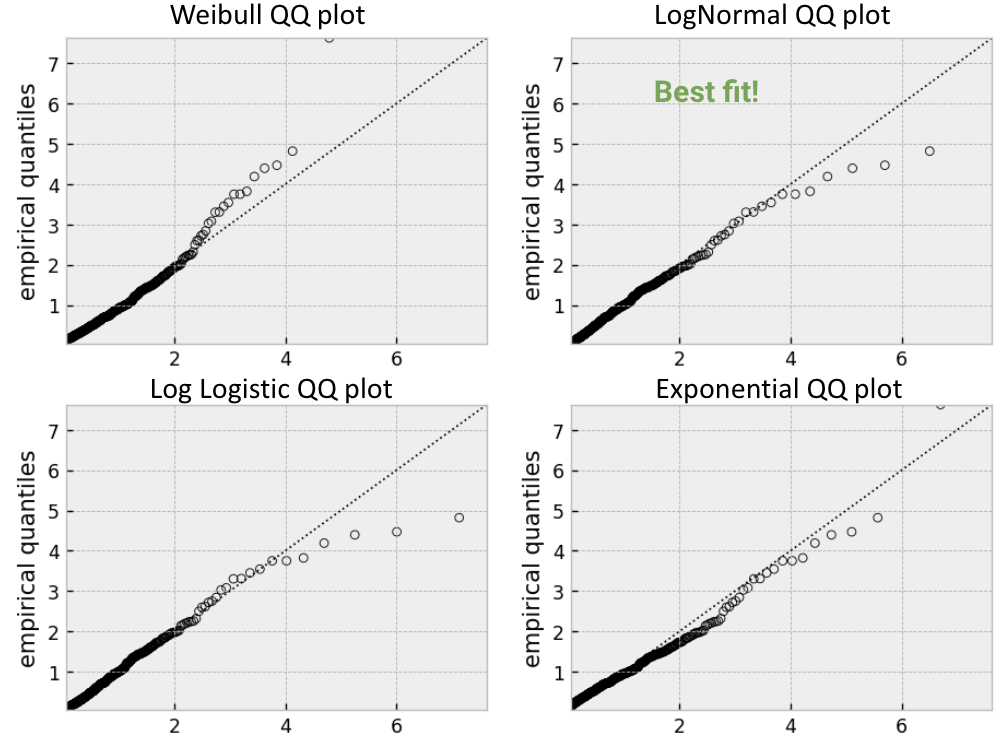
Bước 1) Khớp các mô hình tham số trong lifelines.
Bước 2) Vẽ biểu đồ QQ cho từng mô hình.
Bước 3) Ưu tiên biểu đồ QQ gần y = x nhất.
from lifelines.plotting import qq_plotfor model in [WeibullFitter(), LogNormalFitter(), LogLogisticFitter(), ExponentialFitter()]: model.fit(T, E) qq_plot(model)plt.show()

Phân tích sống sót bằng Python