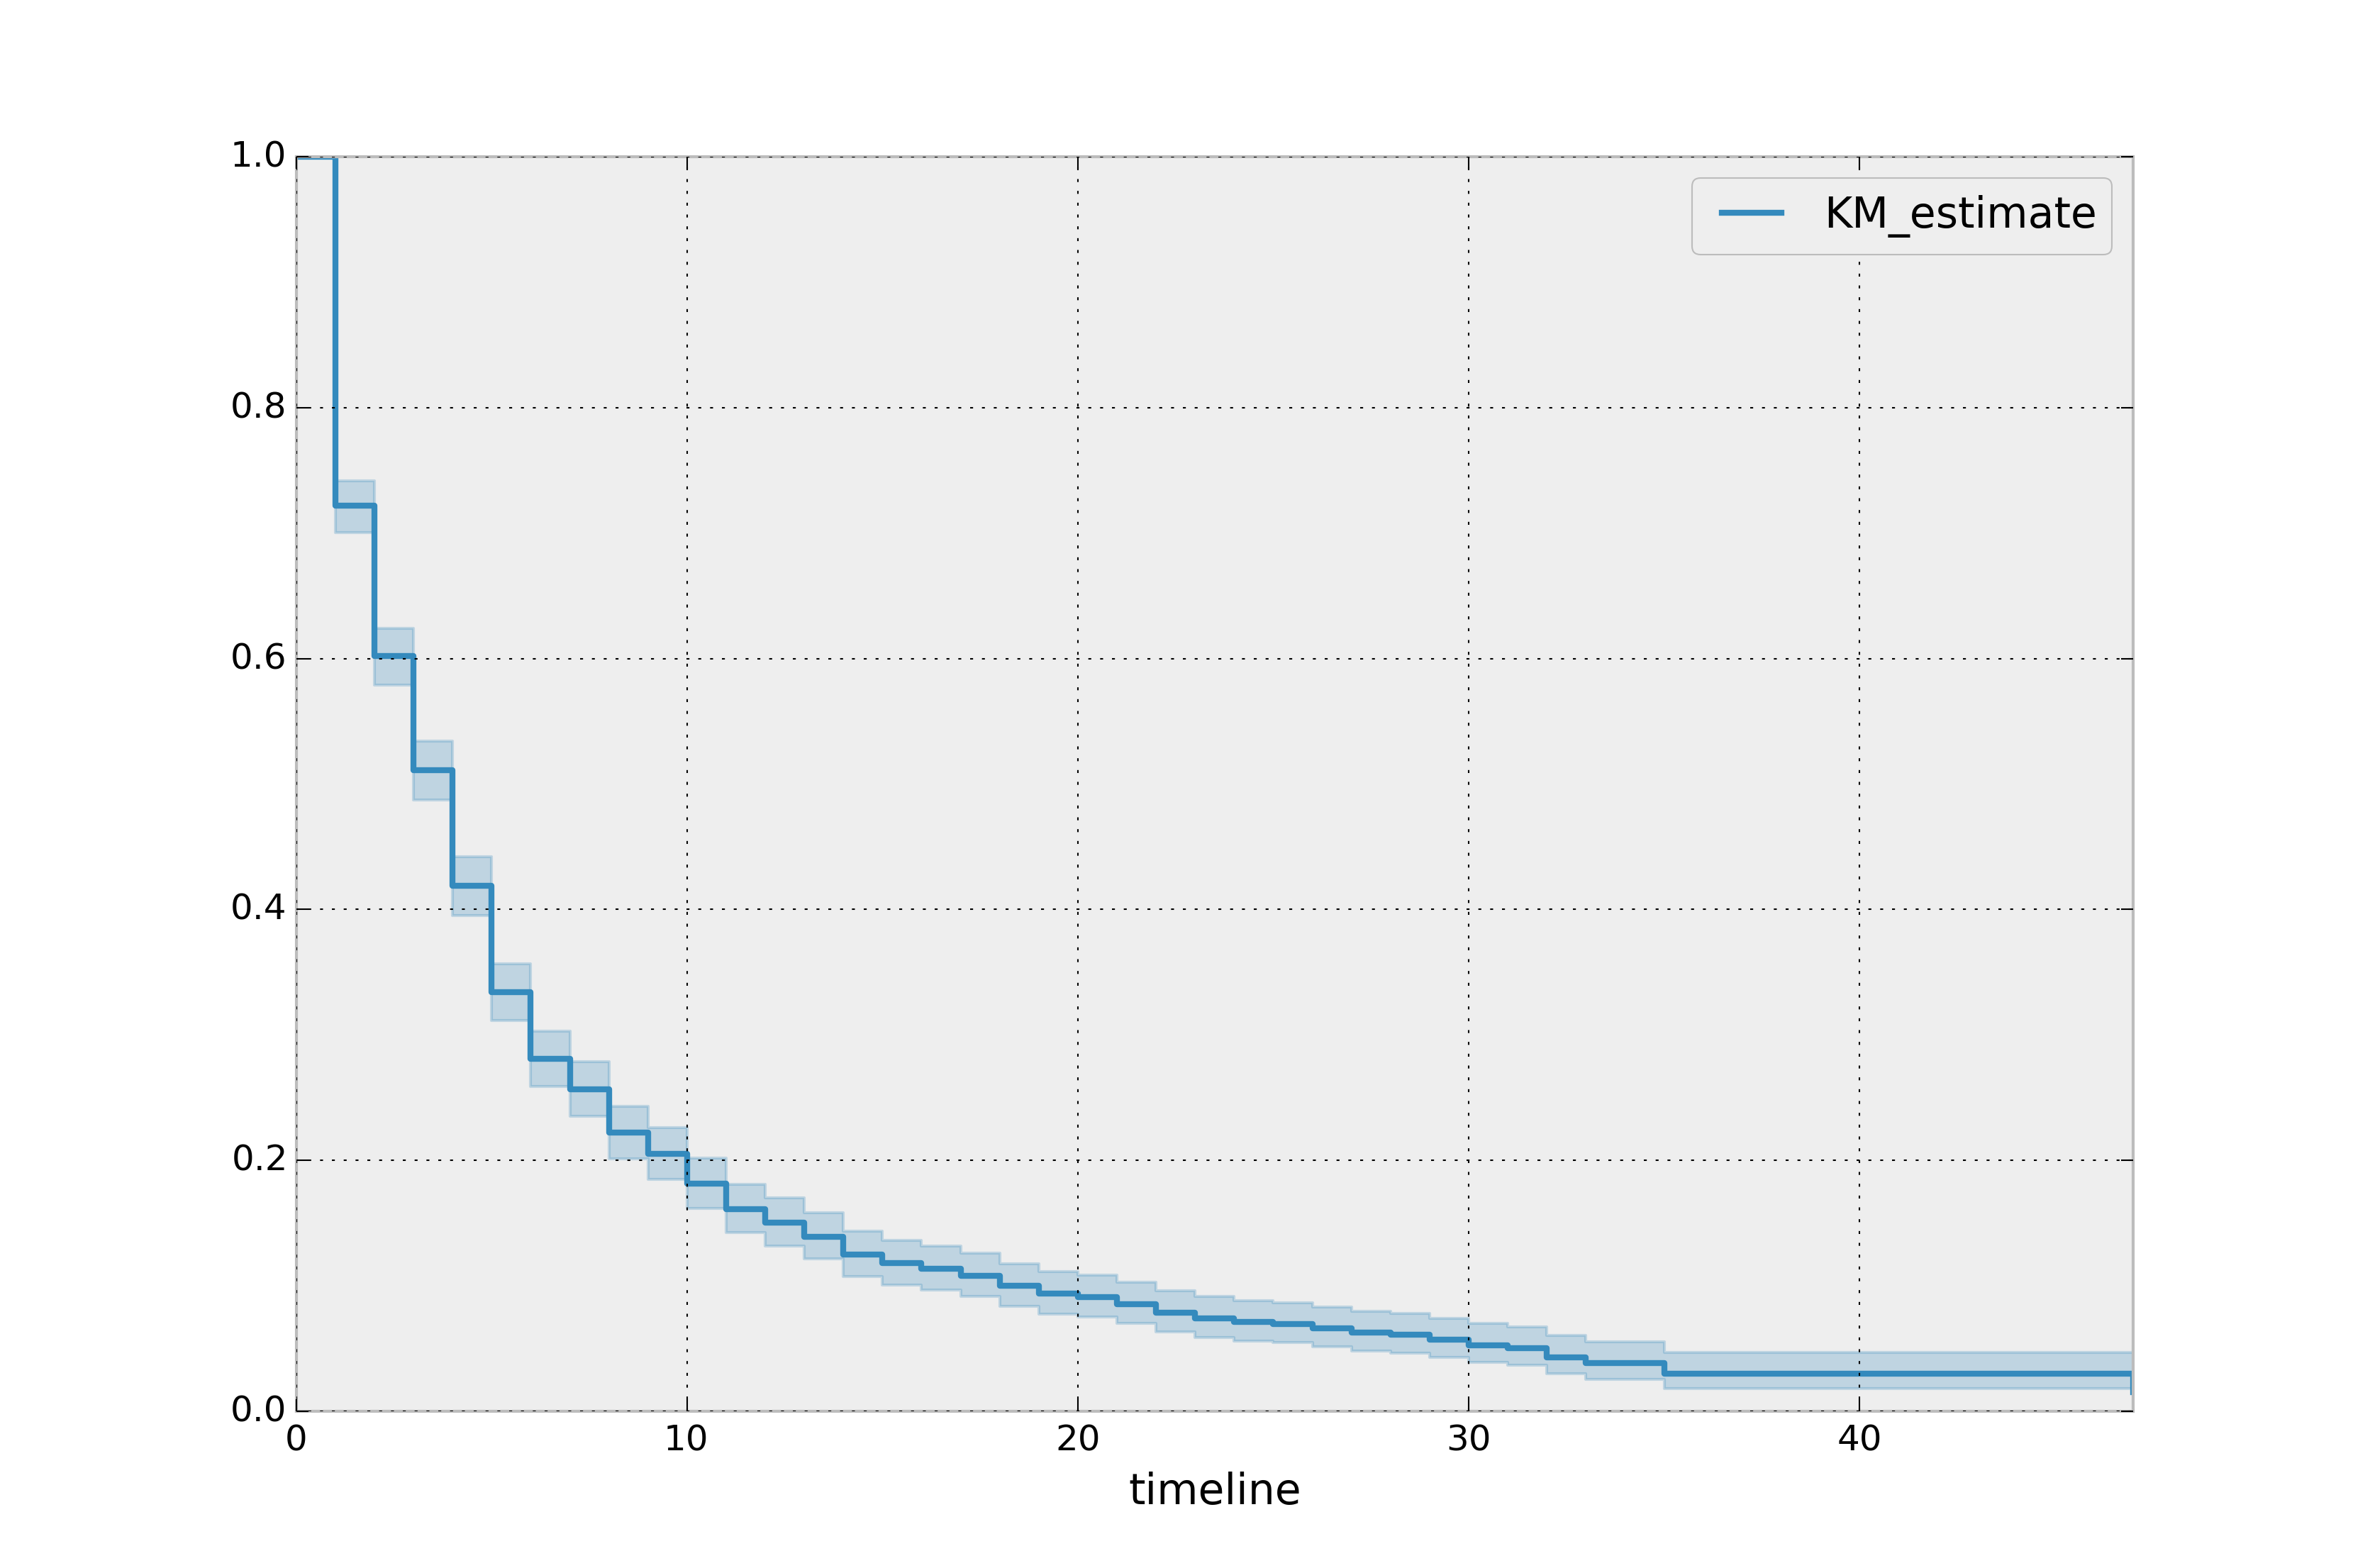
Đường cong sống còn đầu tiên của bạn!
Phân tích sống sót bằng Python

Shae Wang
Senior Data Scientist
Đường cong sống còn
$$\Large{S(t) = Pr(T>t)}$$
Đường cong sống còn
$$\Large{S(t) = Pr(T>t)}$$
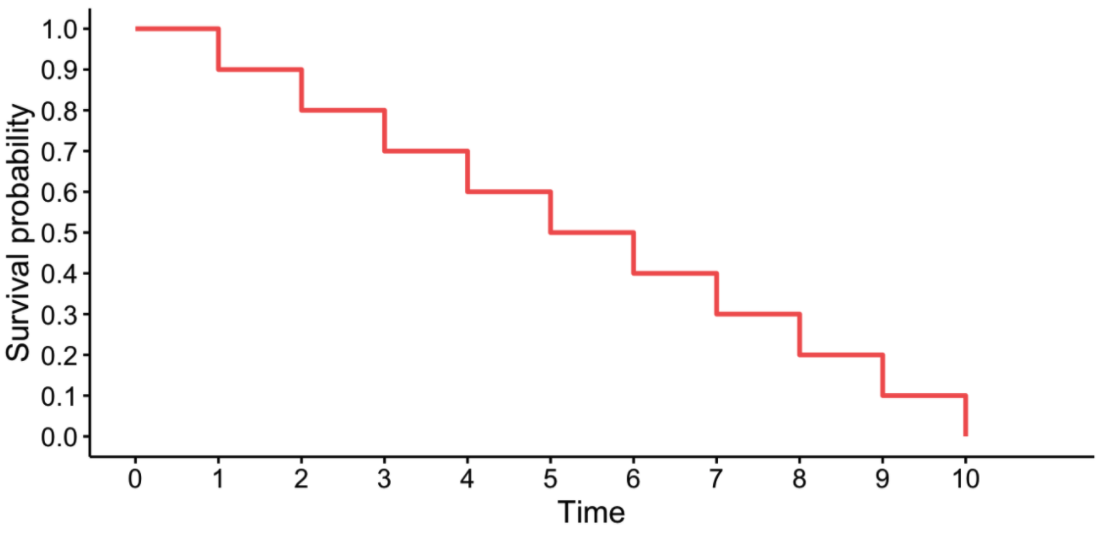
Đường cong sống còn
$$\Large{S(t) = Pr(T>t)}$$
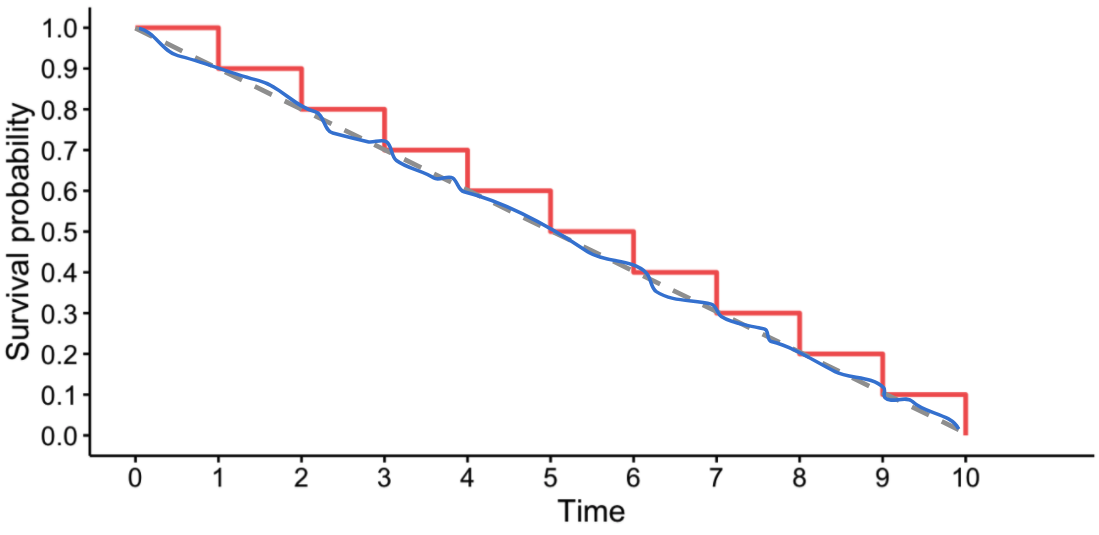
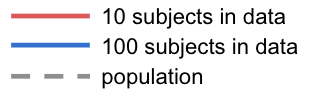
Diễn giải đường cong sống còn
Diễn giải đường cong sống còn
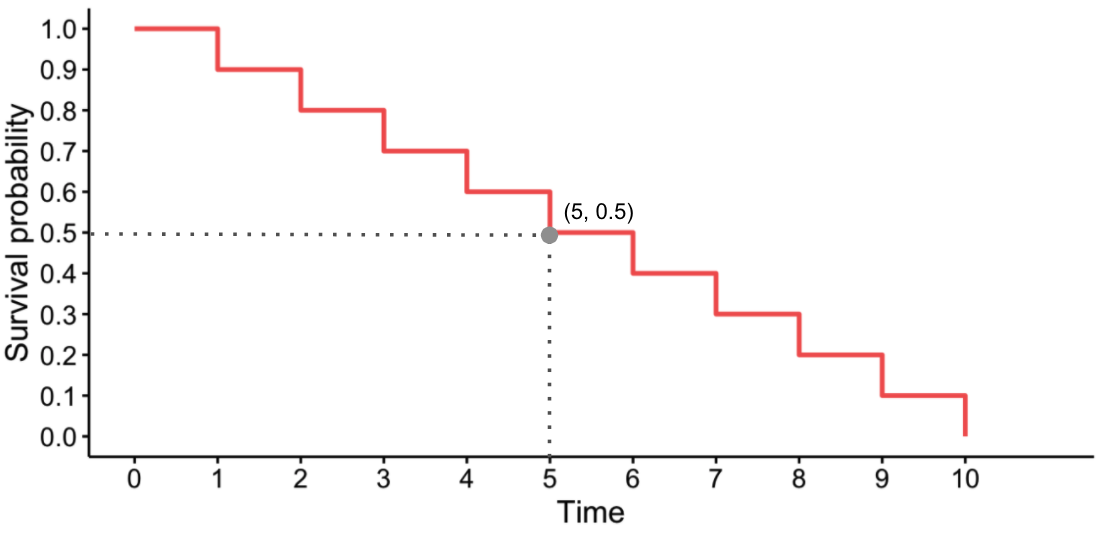
Mô hình phi tham số và tham số
Mô hình phi tham số
- Đường cong sống còn thường KHÔNG mượt
Mô hình tham số
- Đường cong sống còn thường mượt
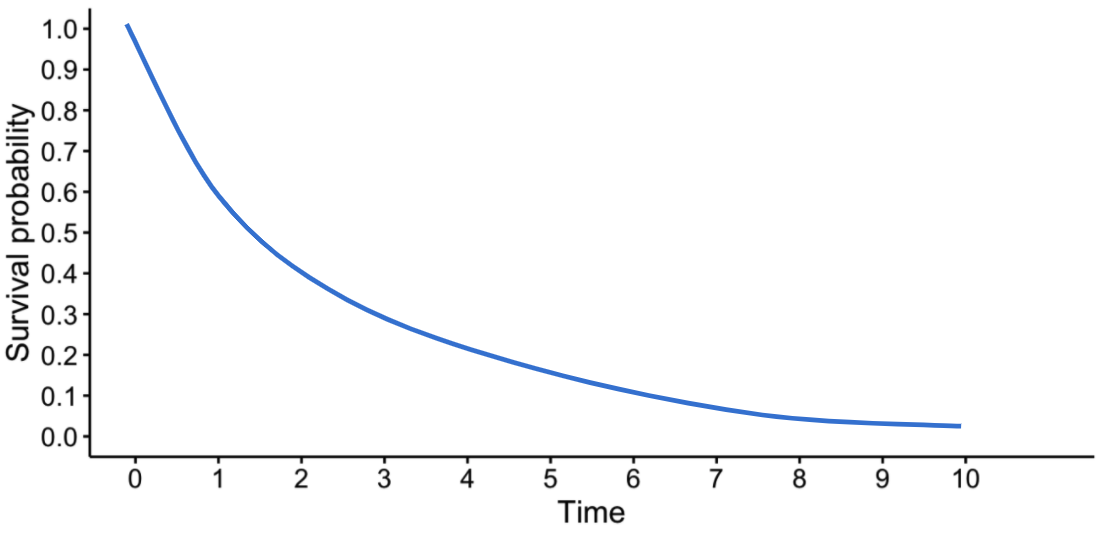
- Phụ thuộc mô hình tham số mô tả dữ liệu đủ tốt
Ví dụ đường cong sống còn