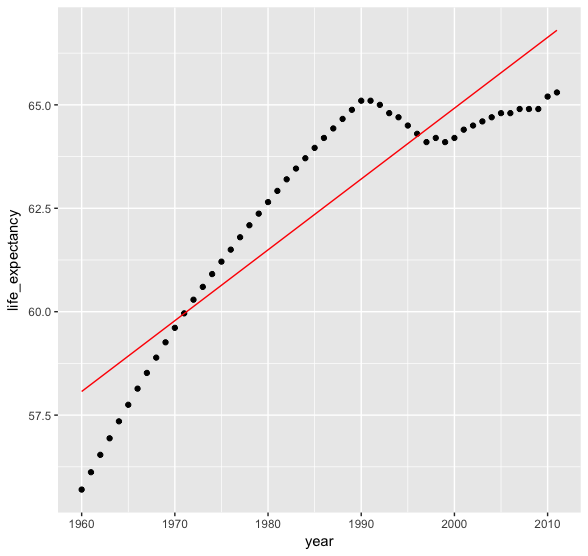
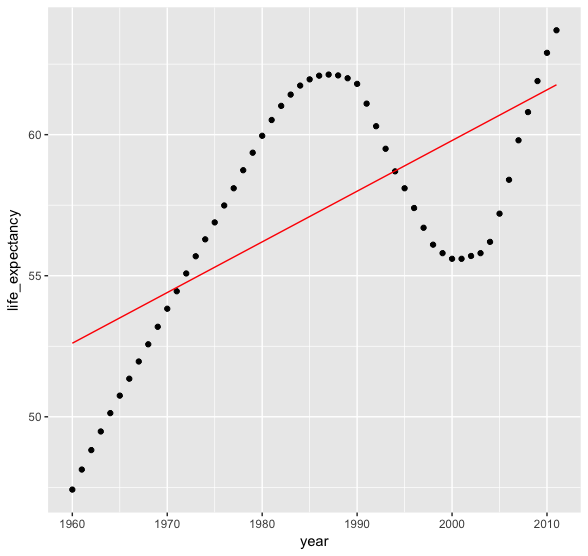
Quan sát trực quan mức độ khớp của mô hình

Machine Learning trong tidyverse

Dmitriy (Dima) Gorenshteyn

Lead Data Scientist, Memorial Sloan Kettering Cancer Center

Xây dựng dataframe mở rộng

augmented_models <- gap_models %>% 
                    mutate(augmented = map(model, ~augment(.x))) %>%
                    unnest(augmented)

augmented_models
# A tibble: 4,004 x 10
   country life_expectancy  year .fitted .se.fit .resid   .hat .sigma 
   <fct>             <dbl> <int>   <dbl>   <dbl>  <dbl>  <dbl>  <dbl> 
 1 Algeria            47.5  1960    47.8   0.595 -0.266 0.0747   2.20 
 2 Algeria            48.0  1961    48.4   0.578 -0.381 0.0705   2.20 
 3 Algeria            48.6  1962    49.0   0.561 -0.486 0.0664   2.20 
 4 Algeria            49.1  1963    49.7   0.544 -0.600 0.0625   2.20 
 5 Algeria            49.6  1964    50.3   0.527 -0.725 0.0587   2.20 
 6 Algeria            50.1  1965    50.9   0.511 -0.850 0.0551   2.20
Machine Learning trong tidyverse

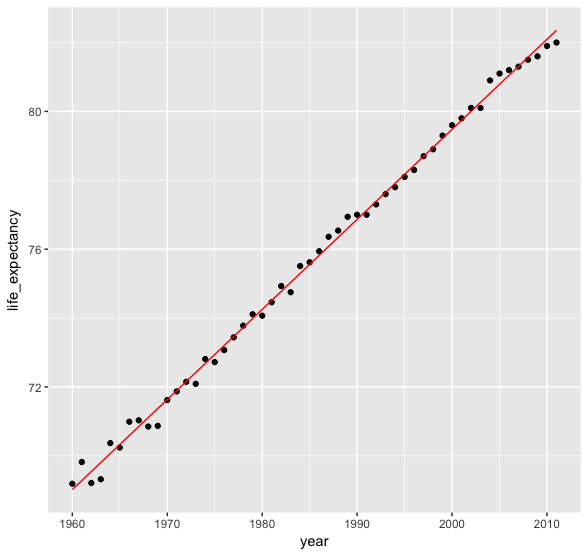
Mô hình cho Italy $R^2: 0.99$

augmented_model %>% filter(country == "Italy") %>% 
  ggplot(aes(x = year, y = life_expectancy)) + 
  geom_point() +
  geom_line(aes(y = .fitted), color = "red")
Machine Learning trong tidyverse

Mô hình cho Fiji $R^2: 0.82$

Machine Learning trong tidyverse

Mô hình cho Kenya $R^2: 0.42$

Machine Learning trong tidyverse

Cùng luyện tập nào!

Machine Learning trong tidyverse

Preparing Video For Download...