Việc làm và Lực lượng lao động

Phân tích dữ liệu Điều tra Dân số Hoa Kỳ bằng Python

Lee Hachadoorian

Asst. Professor of Instruction, Temple University

Khái niệm về việc làm

  • Lực lượng lao động: Người đang làm việc hoặc tìm việc
  • Thất nghiệp: Người không tìm được việc
  • Tỷ lệ thất nghiệp: $$Unemployed / LaborForce$$
  • Tỷ lệ tham gia lực lượng lao động: $$LaborForce / WorkingAgePop$$
Phân tích dữ liệu Điều tra Dân số Hoa Kỳ bằng Python

Vẽ biểu đồ cột

   year  pct_unemployed
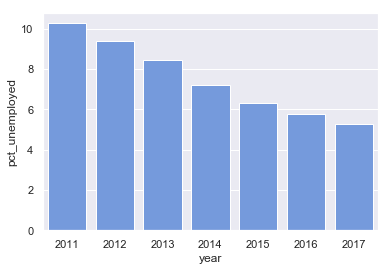
0  2011       10.264992
0  2012        9.373092
0  2013        8.435212
0  2014        7.226895
0  2015        6.297886
0  2016        5.750313
0  2017        5.281027
sns.barplot(
  x = "year", y = "pct_unemployed", 
  color = "cornflowerblue", 
  data = employment)

Biểu đồ cột thể hiện thất nghiệp theo năm. Cột giảm dần từ 2011 đến 2017.

Phân tích dữ liệu Điều tra Dân số Hoa Kỳ bằng Python

pandas.melt

print(hispanic_unemployment)
   year  pct_hisp_male_25to54_unemp  pct_hisp_female_25to54_unemp
0  2011                    9.352638                     11.426135
0  2012                    8.062535                     10.751855
0  2013                    6.915451                      9.524808
0  2014                    5.724187                      8.285590
0  2015                    5.040303                      7.070101
0  2016                    4.568206                      6.521980
0  2017                    4.184646                      5.706956
Phân tích dữ liệu Điều tra Dân số Hoa Kỳ bằng Python

pandas.melt

# Rename columns
col_rename = {"pct_hisp_male_25to54_unemp": "male",
             "pct_hisp_female_25to54_unemp": "female"}
hispanic_unemployment.rename(columns = col_rename, inplace = True)

# Melt DataFrame tidy_unemp = hispanic_unemployment.melt( id_vars = "year", value_vars = ["male", "female"], var_name = "sex", value_name = "pct_unemployed")
Phân tích dữ liệu Điều tra Dân số Hoa Kỳ bằng Python

pandas.melt

# Rename columns
col_rename = {"pct_hisp_male_25to54_unemp": "male",
             "pct_hisp_female_25to54_unemp": "female"}
hispanic_unemployment.rename(columns = col_rename, inplace = True)

# Melt DataFrame tidy_unemp = hispanic_unemployment.melt( id_vars = "year", # value_vars = ["male", "female"], var_name = "sex", value_name = "pct_unemployed")
Phân tích dữ liệu Điều tra Dân số Hoa Kỳ bằng Python

pandas.melt

    year     sex  pct_unemployed
0   2011    male        9.352638
1   2012    male        8.062535
2   2013    male        6.915451
3   2014    male        5.724187
4   2015    male        5.040303
5   2016    male        4.568206
6   2017    male        4.184646
7   2011  female       11.426135
8   2012  female       10.751855
9   2013  female        9.524808
10  2014  female        8.285590
11  2015  female        7.070101
12  2016  female        6.521980
13  2017  female        5.706956
Phân tích dữ liệu Điều tra Dân số Hoa Kỳ bằng Python

Vẽ biểu đồ cột nhóm

sns.barplot(x = "year", y = "pct_unemployed", hue = "sex", 
            data = tidy_unemp)
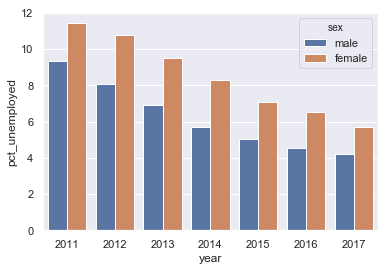
Biểu đồ cột nhóm thể hiện thất nghiệp theo năm, tách theo nam và nữ. Cột giảm dần từ 2011 đến 2017. Thất nghiệp nam luôn thấp hơn nữ.

Phân tích dữ liệu Điều tra Dân số Hoa Kỳ bằng Python

Hãy luyện tập!

Phân tích dữ liệu Điều tra Dân số Hoa Kỳ bằng Python

Preparing Video For Download...