Phân cụm và mô hình cụm
Mô phỏng Sự kiện Rời rạc bằng Python

Diogo Costa (PhD, MSc)
Adjunct Professor, University of Saskatchewan, Canada & CEO of ImpactBLUE-Scientific
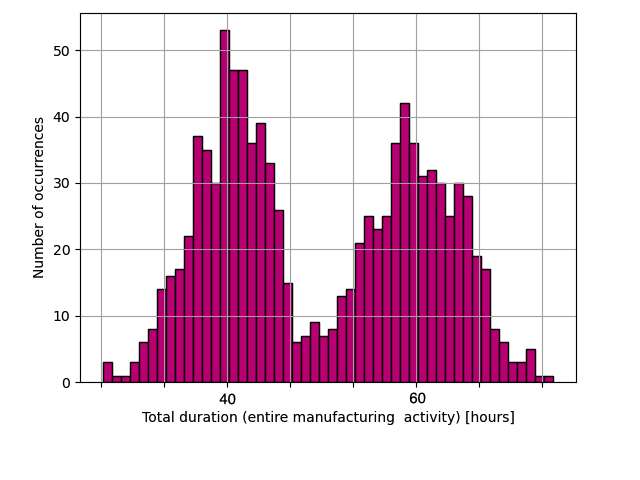
Histogram của kết quả mô hình
Dùng: Tạo histogram cho tập data với 50 bins
plt.hist(data, bins=50)
Phân tích cụm và ứng dụng cho mô hình
- Ứng dụng
- Nhận dạng mẫu (ví dụ: kết quả mô hình)
- Phân tích ảnh

- Nén dữ liệu
- Đồ họa máy tính
Máy học

Trong mô hình sự kiện rời rạc
- Xác định mẫu đầu ra mô hình
- Thông tin hữu ích hơn
Phân cụm k-means
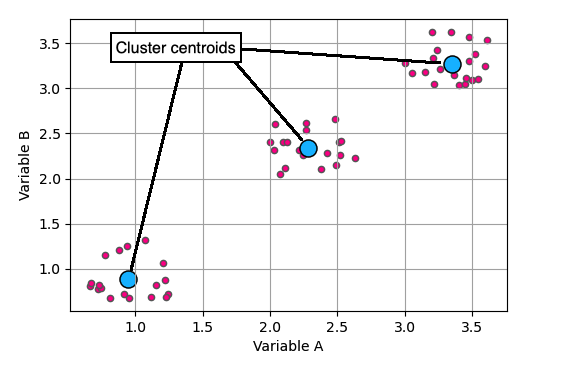
Quan sát và tâm cụm
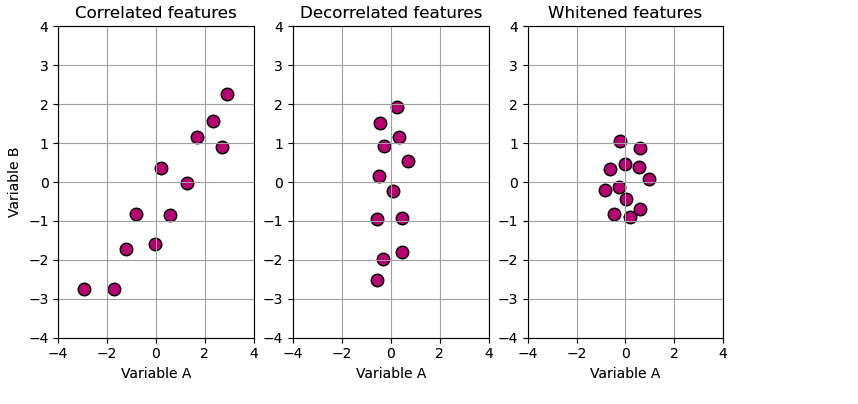
Làm trắng dữ liệu: Khử tương quan và chuẩn tỉ lệ
Trước khi chạy k-means: Làm trắng dữ liệu
- Khử tương quan dữ liệu
obs - Chuẩn tỉ lệ từng chiều của
obstheo độ lệch chuẩn
Ví dụ: làm trắng và k-means
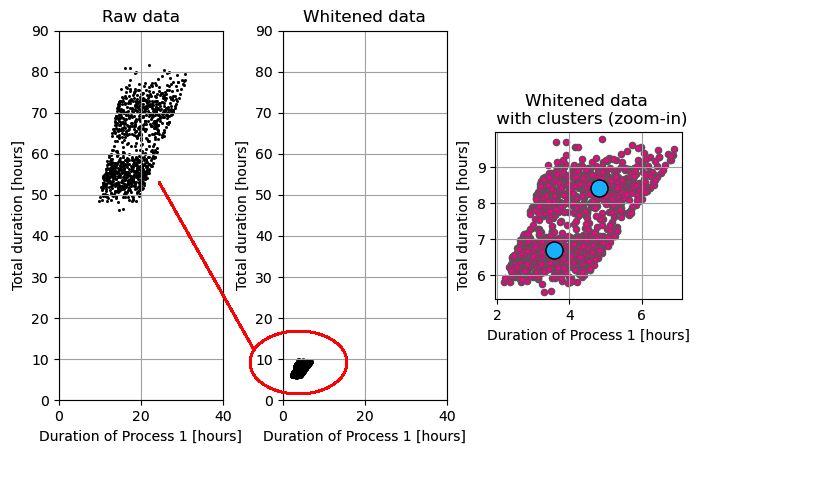
- Hoạt động sản xuất gồm nhiều quy trình
- Xem xét ảnh hưởng của
Process 1