R dành cho người dùng SAS
Melinda Higgins, PhD
Research Professor/Senior Biostatistician Emory University

ggplot2 là gói đồ họa mạnh cho Rggplot là "ngữ pháp đồ họa"ggplot2 xây đồ thị theo lớp (layering)# Create plot for x=sex and y=diameter
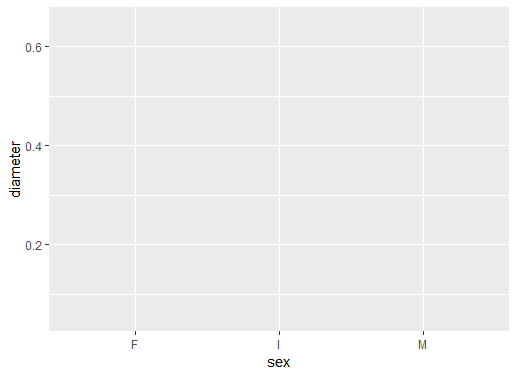
ggplot(data = abalone, aes(sex, diameter))
ggplot()data = abaloneĐặt aes là sex và diameter
Chưa có đối tượng đồ họa nào
sexdiameter
# Add boxplot geometric object or geom
ggplot(data = abalone,
aes(sex, diameter)) +
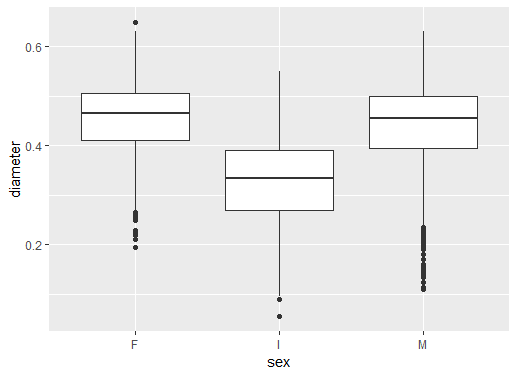
geom_boxplot()
+ thêm lớpThêm boxplot geom_boxplot()
Kết quả là loạt boxplot
F cái, I non, M đực
# Add black white theme
ggplot(data = abalone,
aes(sex, diameter)) +
geom_boxplot() +
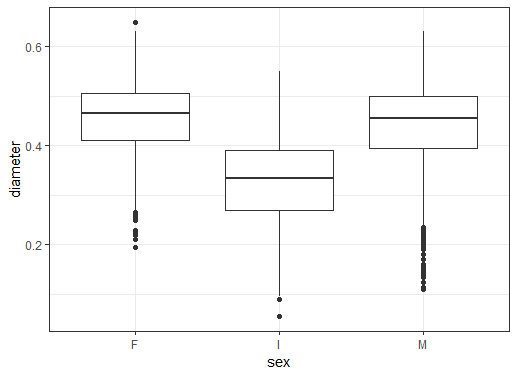
theme_bw()
theme_bw()
# Change to geom_violin()
ggplot(data = abalone,
aes(sex, diameter)) +
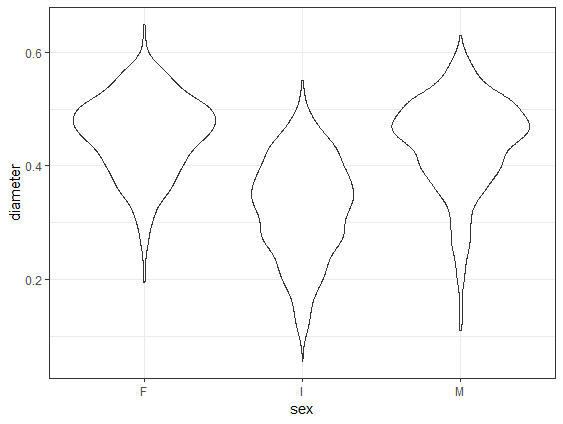
geom_violin() +
theme_bw()
geom_violin thay geom_boxplot
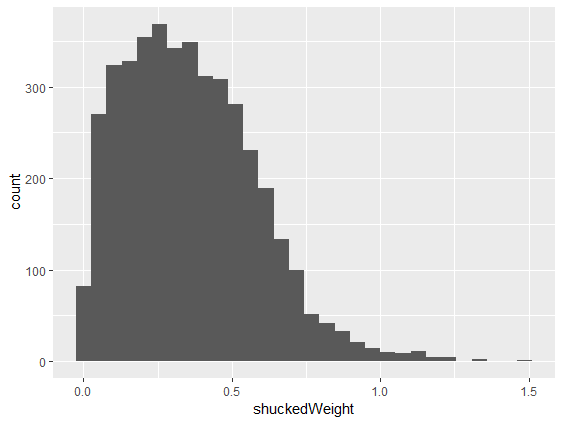
# Make histogram of shuckedWeight
ggplot(abalone, aes(shuckedWeight)) +
geom_histogram()
geom_histogram()aes() là shuckedWeight
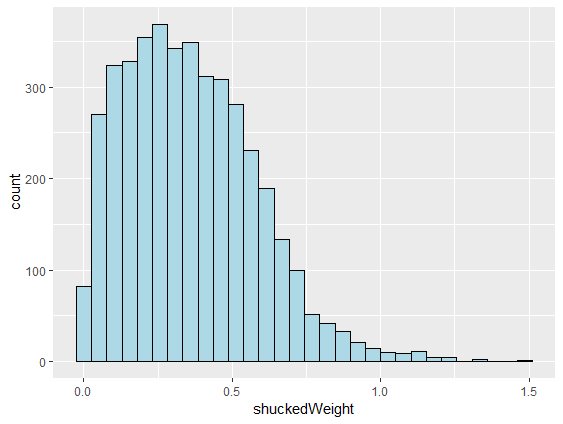
# Make lines black and fill light blue
ggplot(abalone, aes(shuckedWeight)) +
geom_histogram(color = "black",
fill = "lightblue")
color cho viền cộtfill cho cột()
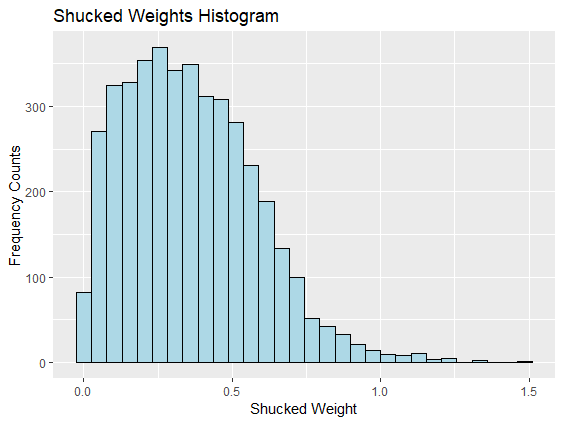
# Add x, y axis labels and title
ggplot(abalone, aes(shuckedWeight)) +
geom_histogram(color = "black",
fill = "lightblue") +
xlab("Shucked Weight") +
ylab("Frequency Counts") +
ggtitle("Shucked Weights Histogram")
xlab() và ylab() cho trụcggtitle() cho tiêu đề
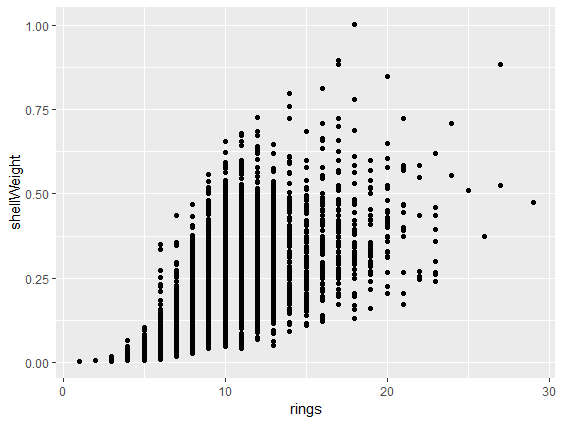
# Make scatterplot with geom_point()
ggplot(abalone,
aes(rings, shellWeight)) +
geom_point()
aes cần hai biếngeom_point() thêm các điểm
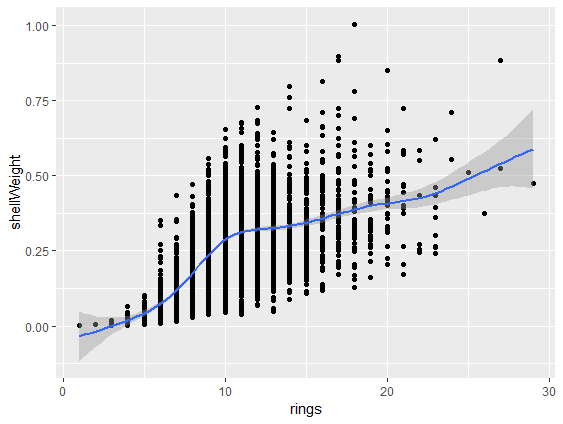
# Add smoothed fit line
ggplot(abalone,
aes(rings, shellWeight)) +
geom_point() +
geom_smooth()
geom_smooth() vào scatterplot
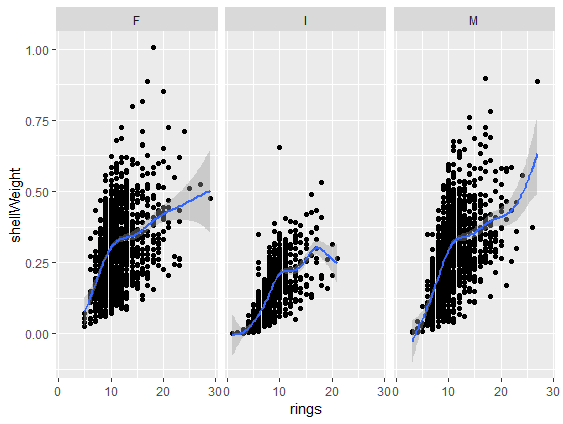
# Add panels using facet_wrap()
ggplot(abalone,
aes(rings, shellWeight)) +
geom_point() +
geom_smooth() +
facet_wrap(vars(sex))
facet_wrap()vars(sex) xác định biến phân ô
ggplot2R dành cho người dùng SAS