Trực quan hóa mạng Twitter

Phân tích dữ liệu mạng xã hội bằng R

Sowmya Vivek

Data Science Coach

Tổng quan bài học

  • Vẽ mạng với tham số mặc định
  • Áp dụng thuộc tính định dạng để dễ đọc hơn
  • Dùng trung tâm mạng và thuộc tính để cải thiện biểu đồ
Phân tích dữ liệu mạng xã hội bằng R

Xem mạng retweet

# View the retweet network
print.igraph(nw_rtweet)
IGRAPH e7e618c DN-- 21 39 -- 
+ attr: name (v/c), followers (v/c)
+ edges from e7e618c (vertex names):
 [1] w3daily    ->RealFirstBuzz   w3daily    ->RealFirstBuzz  
 [3] w3daily    ->Giasaysthat     w3daily    ->RealFirstBuzz  
 [5] VanesEtim  ->PotionVanity    VanesEtim  ->DAVIDxCGN      
 [7] VanesEtim  ->PotionVanity    VanesEtim  ->Avinash_galaxy 
 [9] VanesEtim  ->PotionVanity    VanesEtim  ->BklynLeague    
[11] RedNileShop->Macaw_Blink     RedNileShop->leuqimcouture  
[13] RedNileShop->StoreDiv        RedNileShop->PotionVanity   
[15] RedNileShop->SCISSORSAPPAREL RedNileShop->Themoon12961958
+ ... omitted several edges
Phân tích dữ liệu mạng xã hội bằng R

Tạo biểu đồ mạng cơ bản

# Create the base network plot
set.seed(1234)  
plot.igraph(nw_rtweet)
Phân tích dữ liệu mạng xã hội bằng R

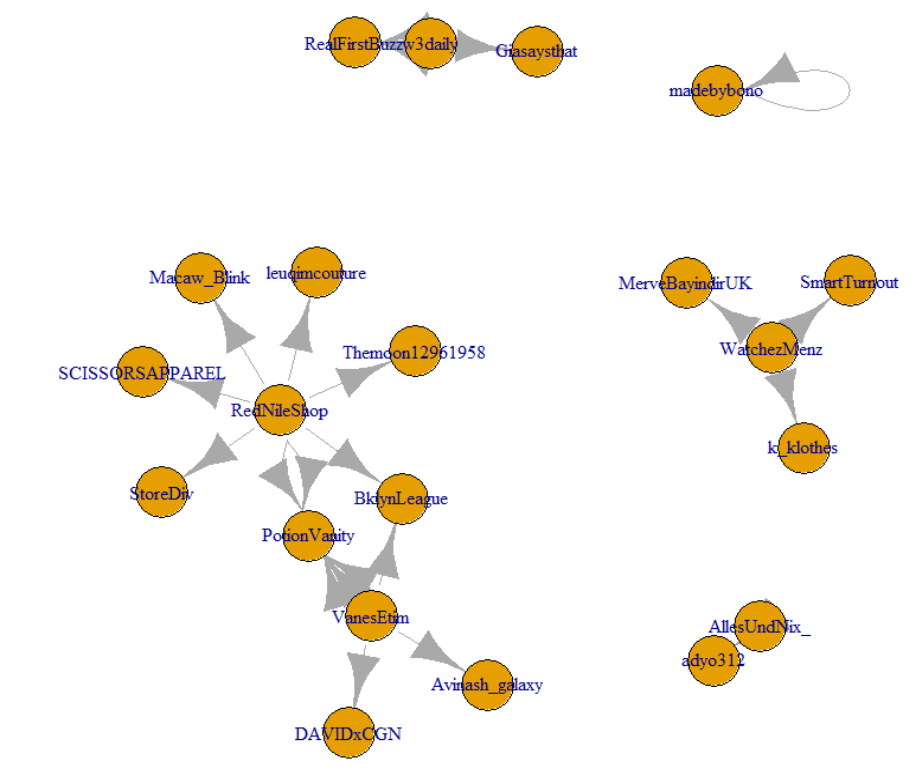
Xem biểu đồ mạng cơ bản

Biểu đồ mạng cơ bản

Phân tích dữ liệu mạng xã hội bằng R

Định dạng biểu đồ

# Format the network plot with attributes
set.seed(1234)
plot(nw_rtweet, asp = 9/16, 
     vertex.size = 10,
     vertex.color = "lightblue",
     edge.arrow.size = 0.5,
     edge.color = "black",
     vertex.label.cex = 0.9,
     vertex.label.color = "black")
Phân tích dữ liệu mạng xã hội bằng R

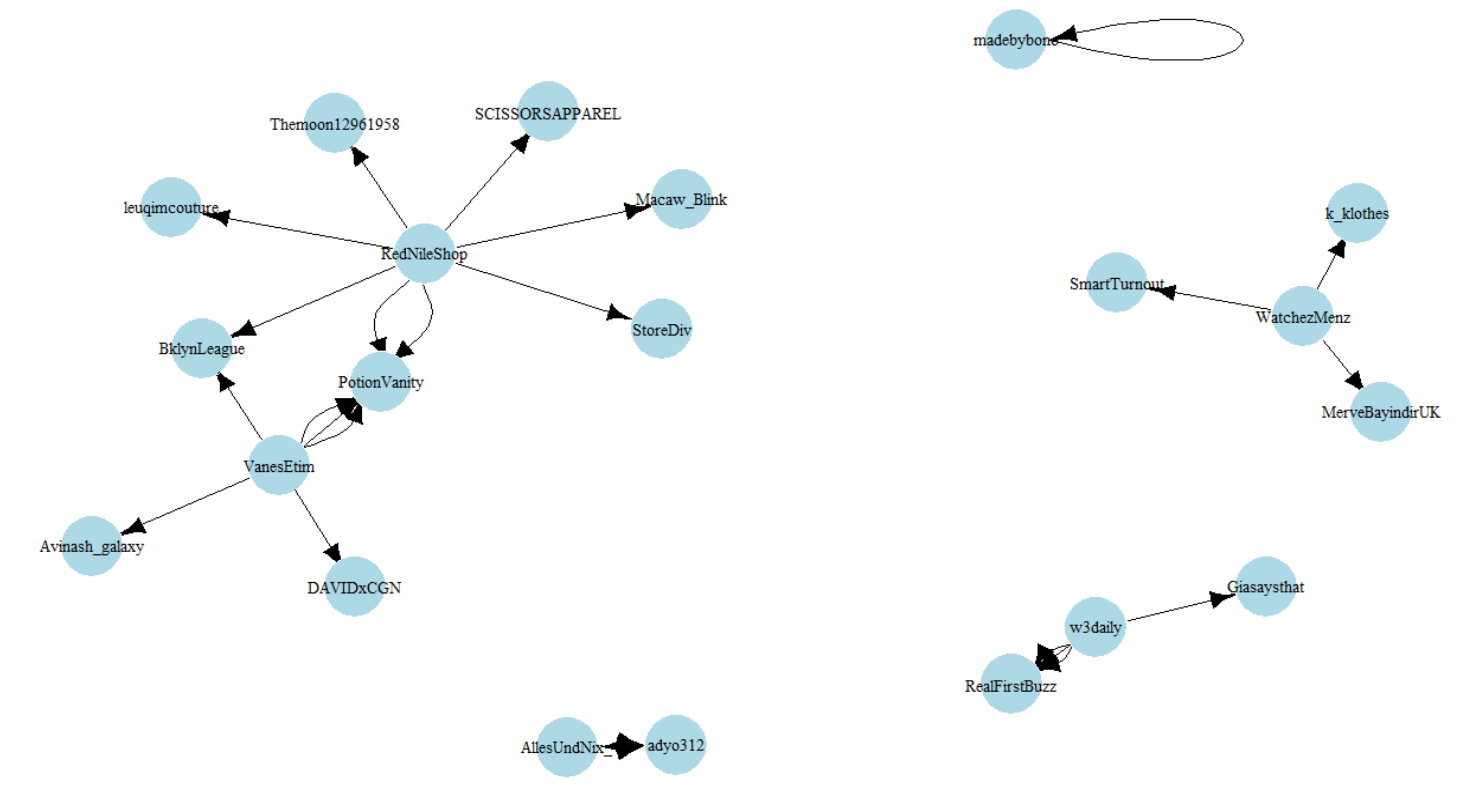
Xem biểu đồ đã định dạng

Biểu đồ mạng đã định dạng

Phân tích dữ liệu mạng xã hội bằng R

Đặt kích thước đỉnh theo bậc ra

# Create a variable for out-degree
deg_out <- degree(nw_rtweet, mode = c("out"))
deg_out
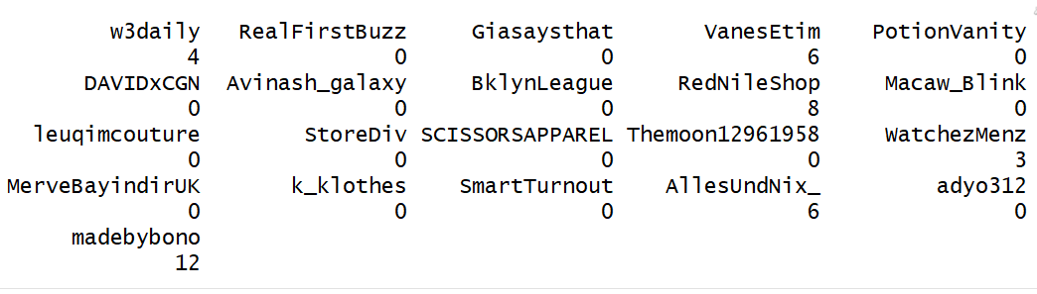
Giá trị bậc ra

vert_size <- (deg_out * 2) + 10
Phân tích dữ liệu mạng xã hội bằng R

Gán vert_size cho thuộc tính kích thước đỉnh

# Assign vert_size to vertex size attribute and plot network
set.seed(1234)
plot(nw_rtweet, asp = 9/16, 
     vertex.size = vert_size,
     vertex.color = "lightblue", 
     edge.arrow.size = 0.5,
     edge.color = "black",
          vertex.label.cex = 1.2,
     vertex.label.color = "black")
Phân tích dữ liệu mạng xã hội bằng R

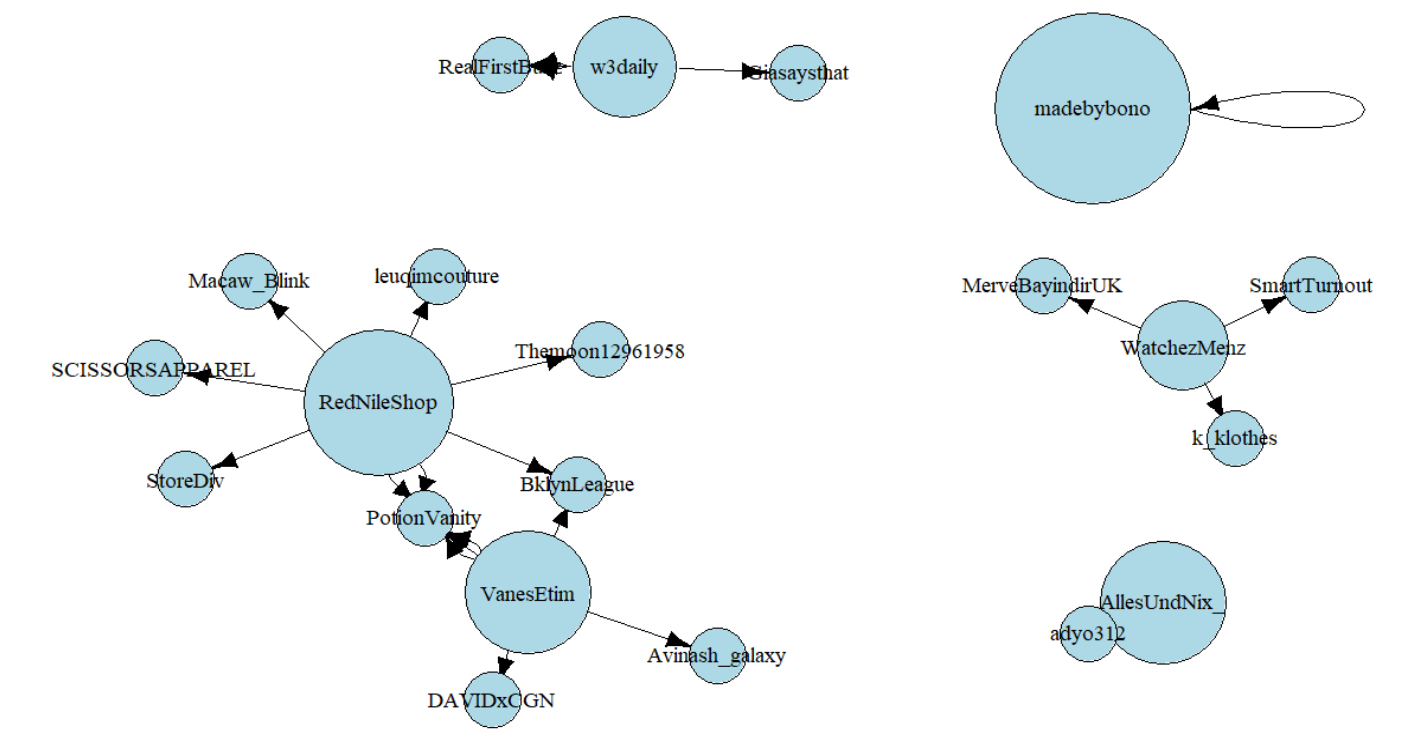
Xem biểu đồ với thuộc tính mới

Biểu đồ với thuộc tính kích thước đỉnh

Phân tích dữ liệu mạng xã hội bằng R

Thêm thuộc tính mạng

  • Người retweet nhiều và có nhiều người theo dõi mang lại giá trị cao hơn
  • Biểu đồ mạng của người retweet nhiều và có nhiều người theo dõi
  • Thêm số người theo dõi làm thuộc tính mạng
Phân tích dữ liệu mạng xã hội bằng R

Số người theo dõi của người dùng trong mạng

# Import the followers count data frame
followers <- readRDS("follower_count.rds")
Phân tích dữ liệu mạng xã hội bằng R

Xem data frame số người theo dõi

# View the follower count
head(followers)
screen_name    followers_count
<fct>             <dbl>
adyo312            58        
AllesUndNix_       18        
Avinash_galaxy     1536        
BklynLeague        40        
DAVIDxCGN          267        
Giasaysthat        9139
Phân tích dữ liệu mạng xã hội bằng R

Số người theo dõi của người dùng trong mạng

# Categorize high and low follower count
followers$follow <- ifelse(followers$followers_count > 500, "1", "0")
Phân tích dữ liệu mạng xã hội bằng R

Xem data frame số người theo dõi

# View the data frame with the new column
head(followers)
screen_name    followers_count    follow
<fct>              <dbl>          <chr>
adyo312              58              0    
AllesUndNix_         18              0    
Avinash_galaxy     1536              1    
BklynLeague          40              0    
DAVIDxCGN           267              0    
Giasaysthat        9139              1
Phân tích dữ liệu mạng xã hội bằng R

Gán thuộc tính mạng

# Assign external network attributes to retweet network
V(nw_rtweet)$followers <- followers$follow
Phân tích dữ liệu mạng xã hội bằng R

Xem thuộc tính đỉnh

# View the vertex attributes
vertex_attr(nw_rtweet)
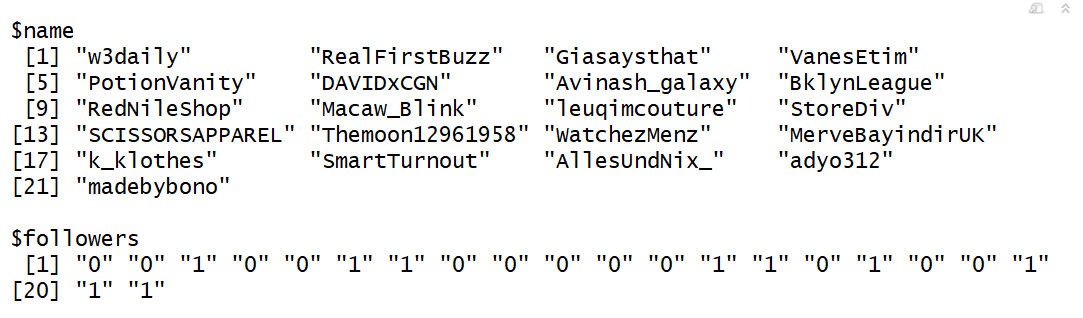
Thuộc tính đỉnh

Phân tích dữ liệu mạng xã hội bằng R

Thay đổi màu đỉnh

# Set the vertex colors for the plot
sub_color <- c("lightgreen", "tomato")
set.seed(1234)
plot(nw_rtweet, asp = 9/16,
     vertex.size = vert_size,
     edge.arrow.size = 0.5,
     vertex.label.cex = 1.3,
     vertex.color = sub_color[as.factor(vertex_attr(nw_rtweet, "followers"))],
     vertex.label.color = "black",
     vertex.frame.color = "grey")
Phân tích dữ liệu mạng xã hội bằng R

Xem biểu đồ định dạng theo thuộc tính đỉnh
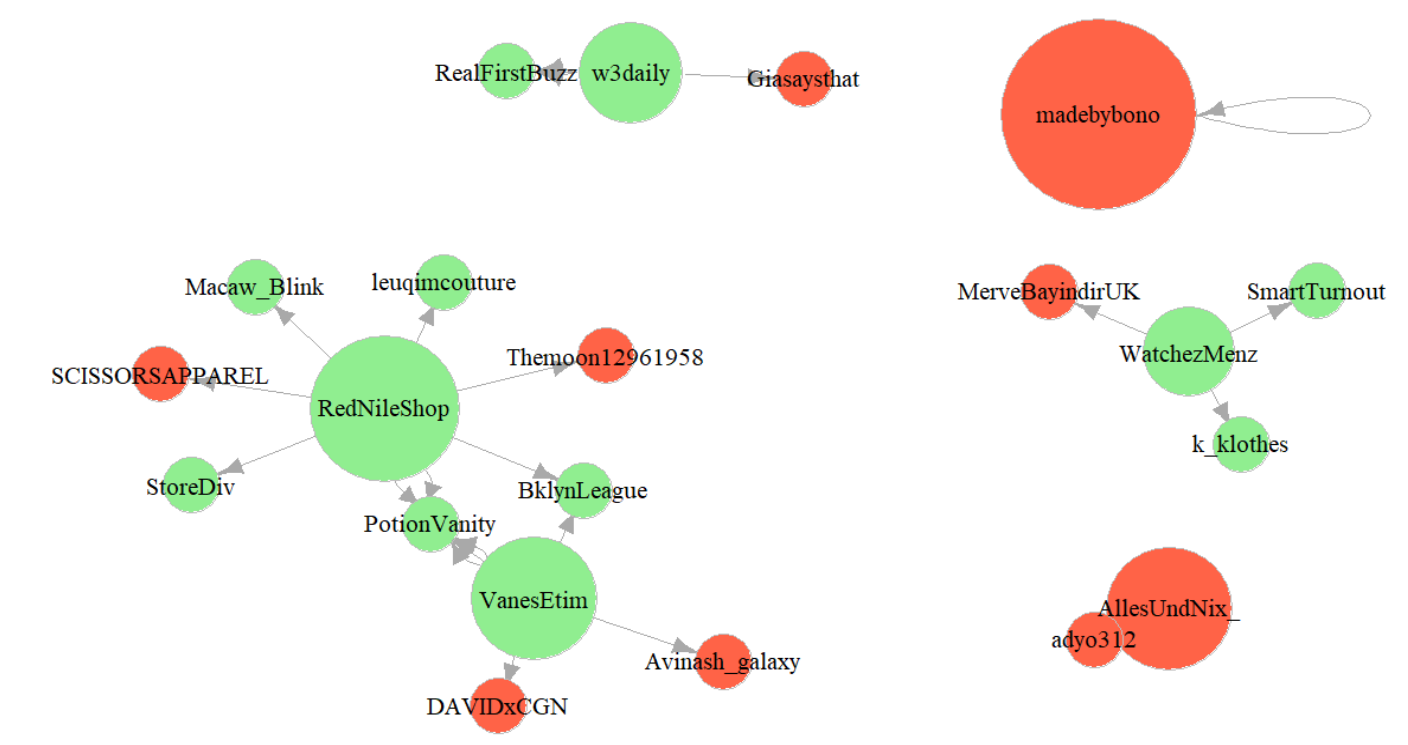
Biểu đồ theo thuộc tính đỉnh

Phân tích dữ liệu mạng xã hội bằng R

Ayo berlatih!

Phân tích dữ liệu mạng xã hội bằng R

Preparing Video For Download...