Python cho người dùng MATLAB
Justin Kiggins
Product Manager
print(arr)
[[2, 4, 8, 16, 32]]
print(arr[2])
8
print(arr[0])
2
print(arr[-1])
32
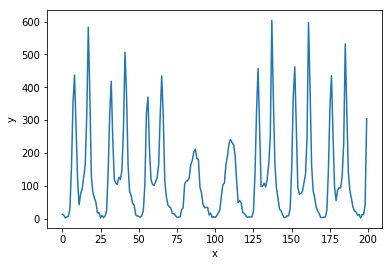
import matplotlib.pyplot as plt
# Tạo figure mới
plt.figure()

# Vẽ y theo x
plt.plot(x, y)

# Đặt nhãn trục x và y
plt.xlabel('x')
plt.ylabel('y')

# Nhớ hiển thị biểu đồ!
plt.show()
# Tạo figure mới plt.figure()
# Vẽ y theo x plt.plot(x, y)
# Đặt nhãn trục x và y plt.xlabel('x') plt.ylabel('y')
# Nhớ hiển thị biểu đồ! plt.show()