Mean vector and variance-covariance matrix

Phân phối Xác suất Đa biến trong R

Surajit Ray

Professor, University of Glasgow

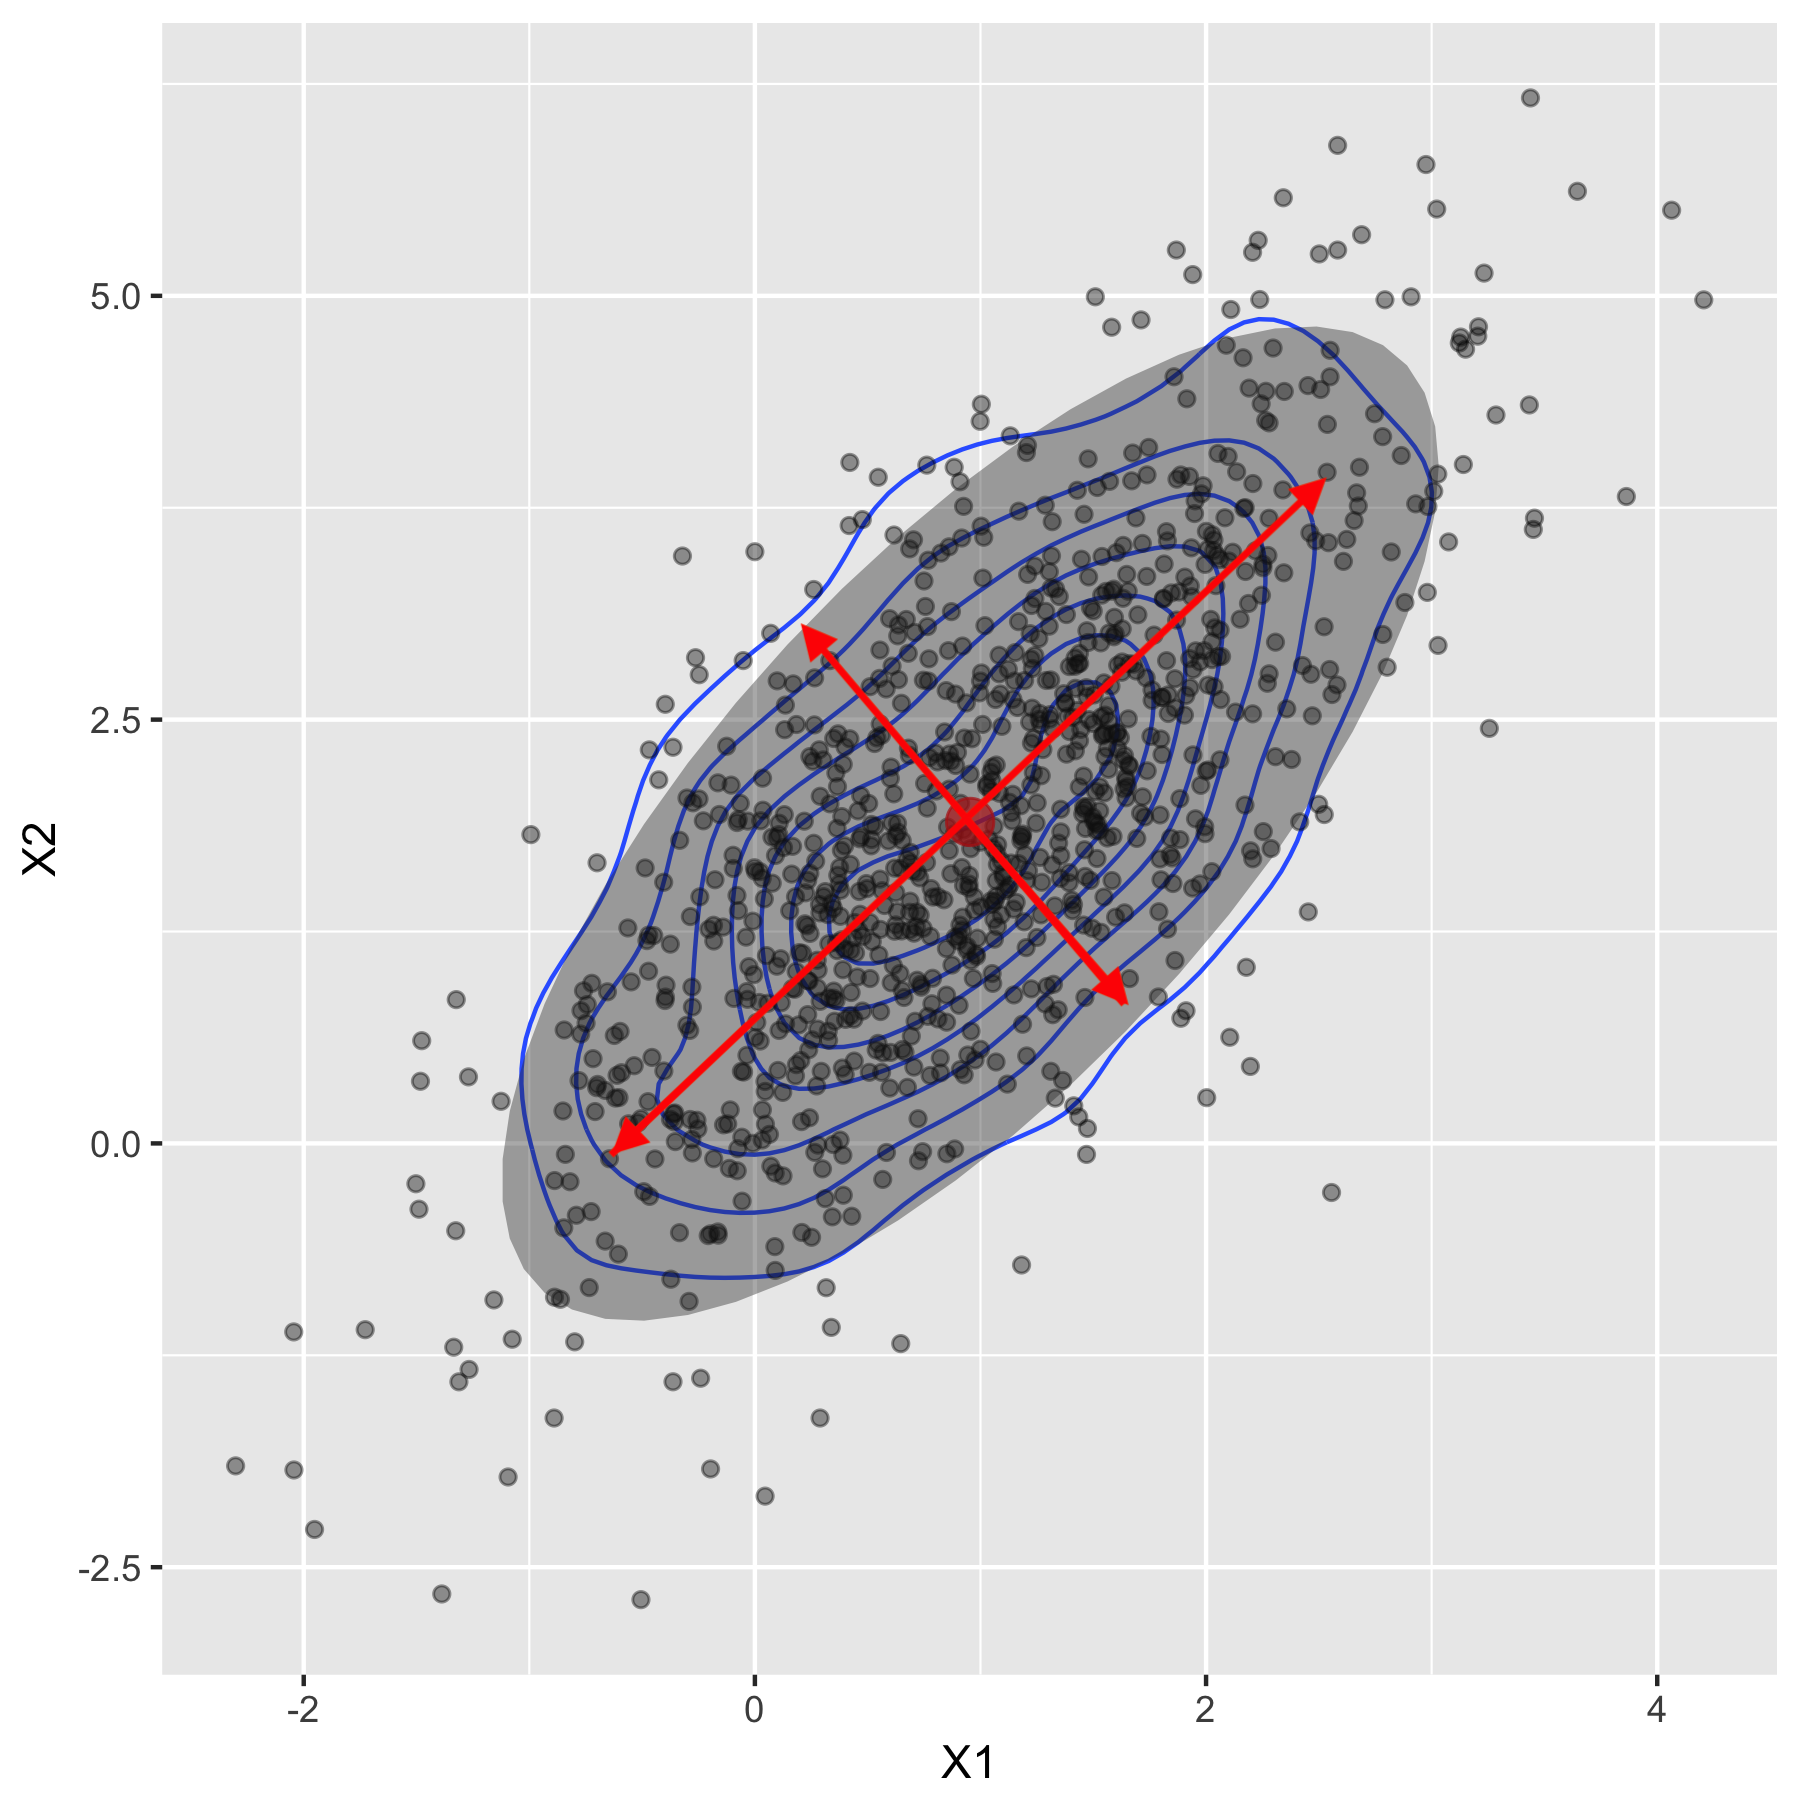
Mean represents the location of the distribution
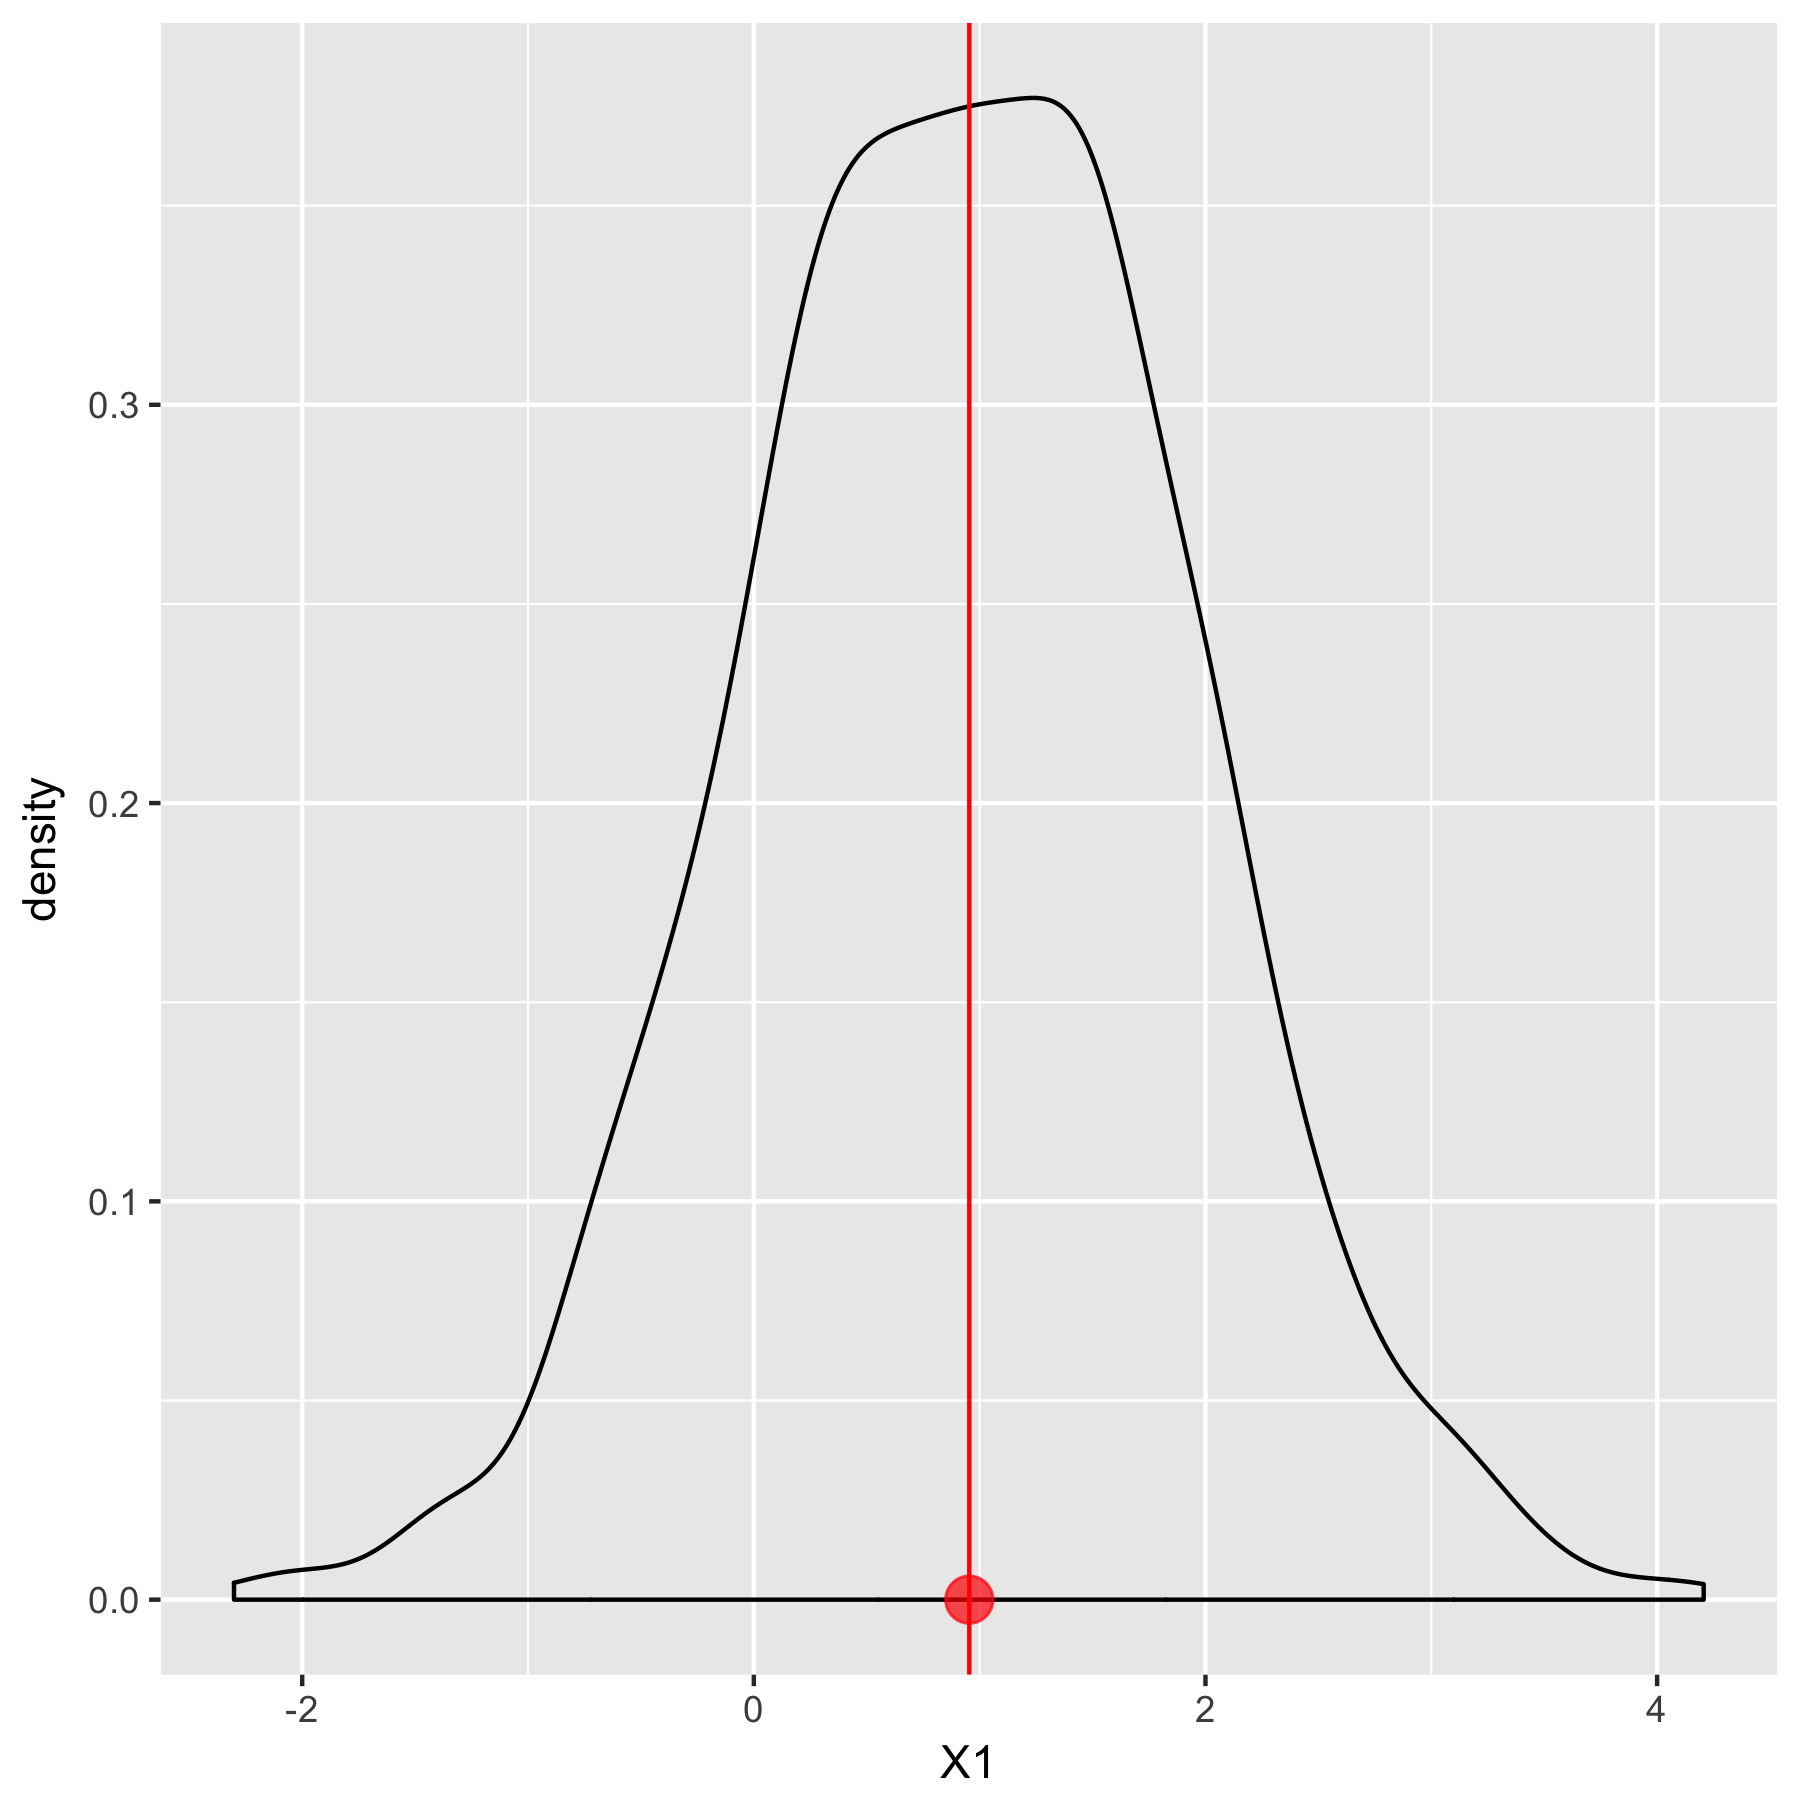
                                               Mean $0.95$
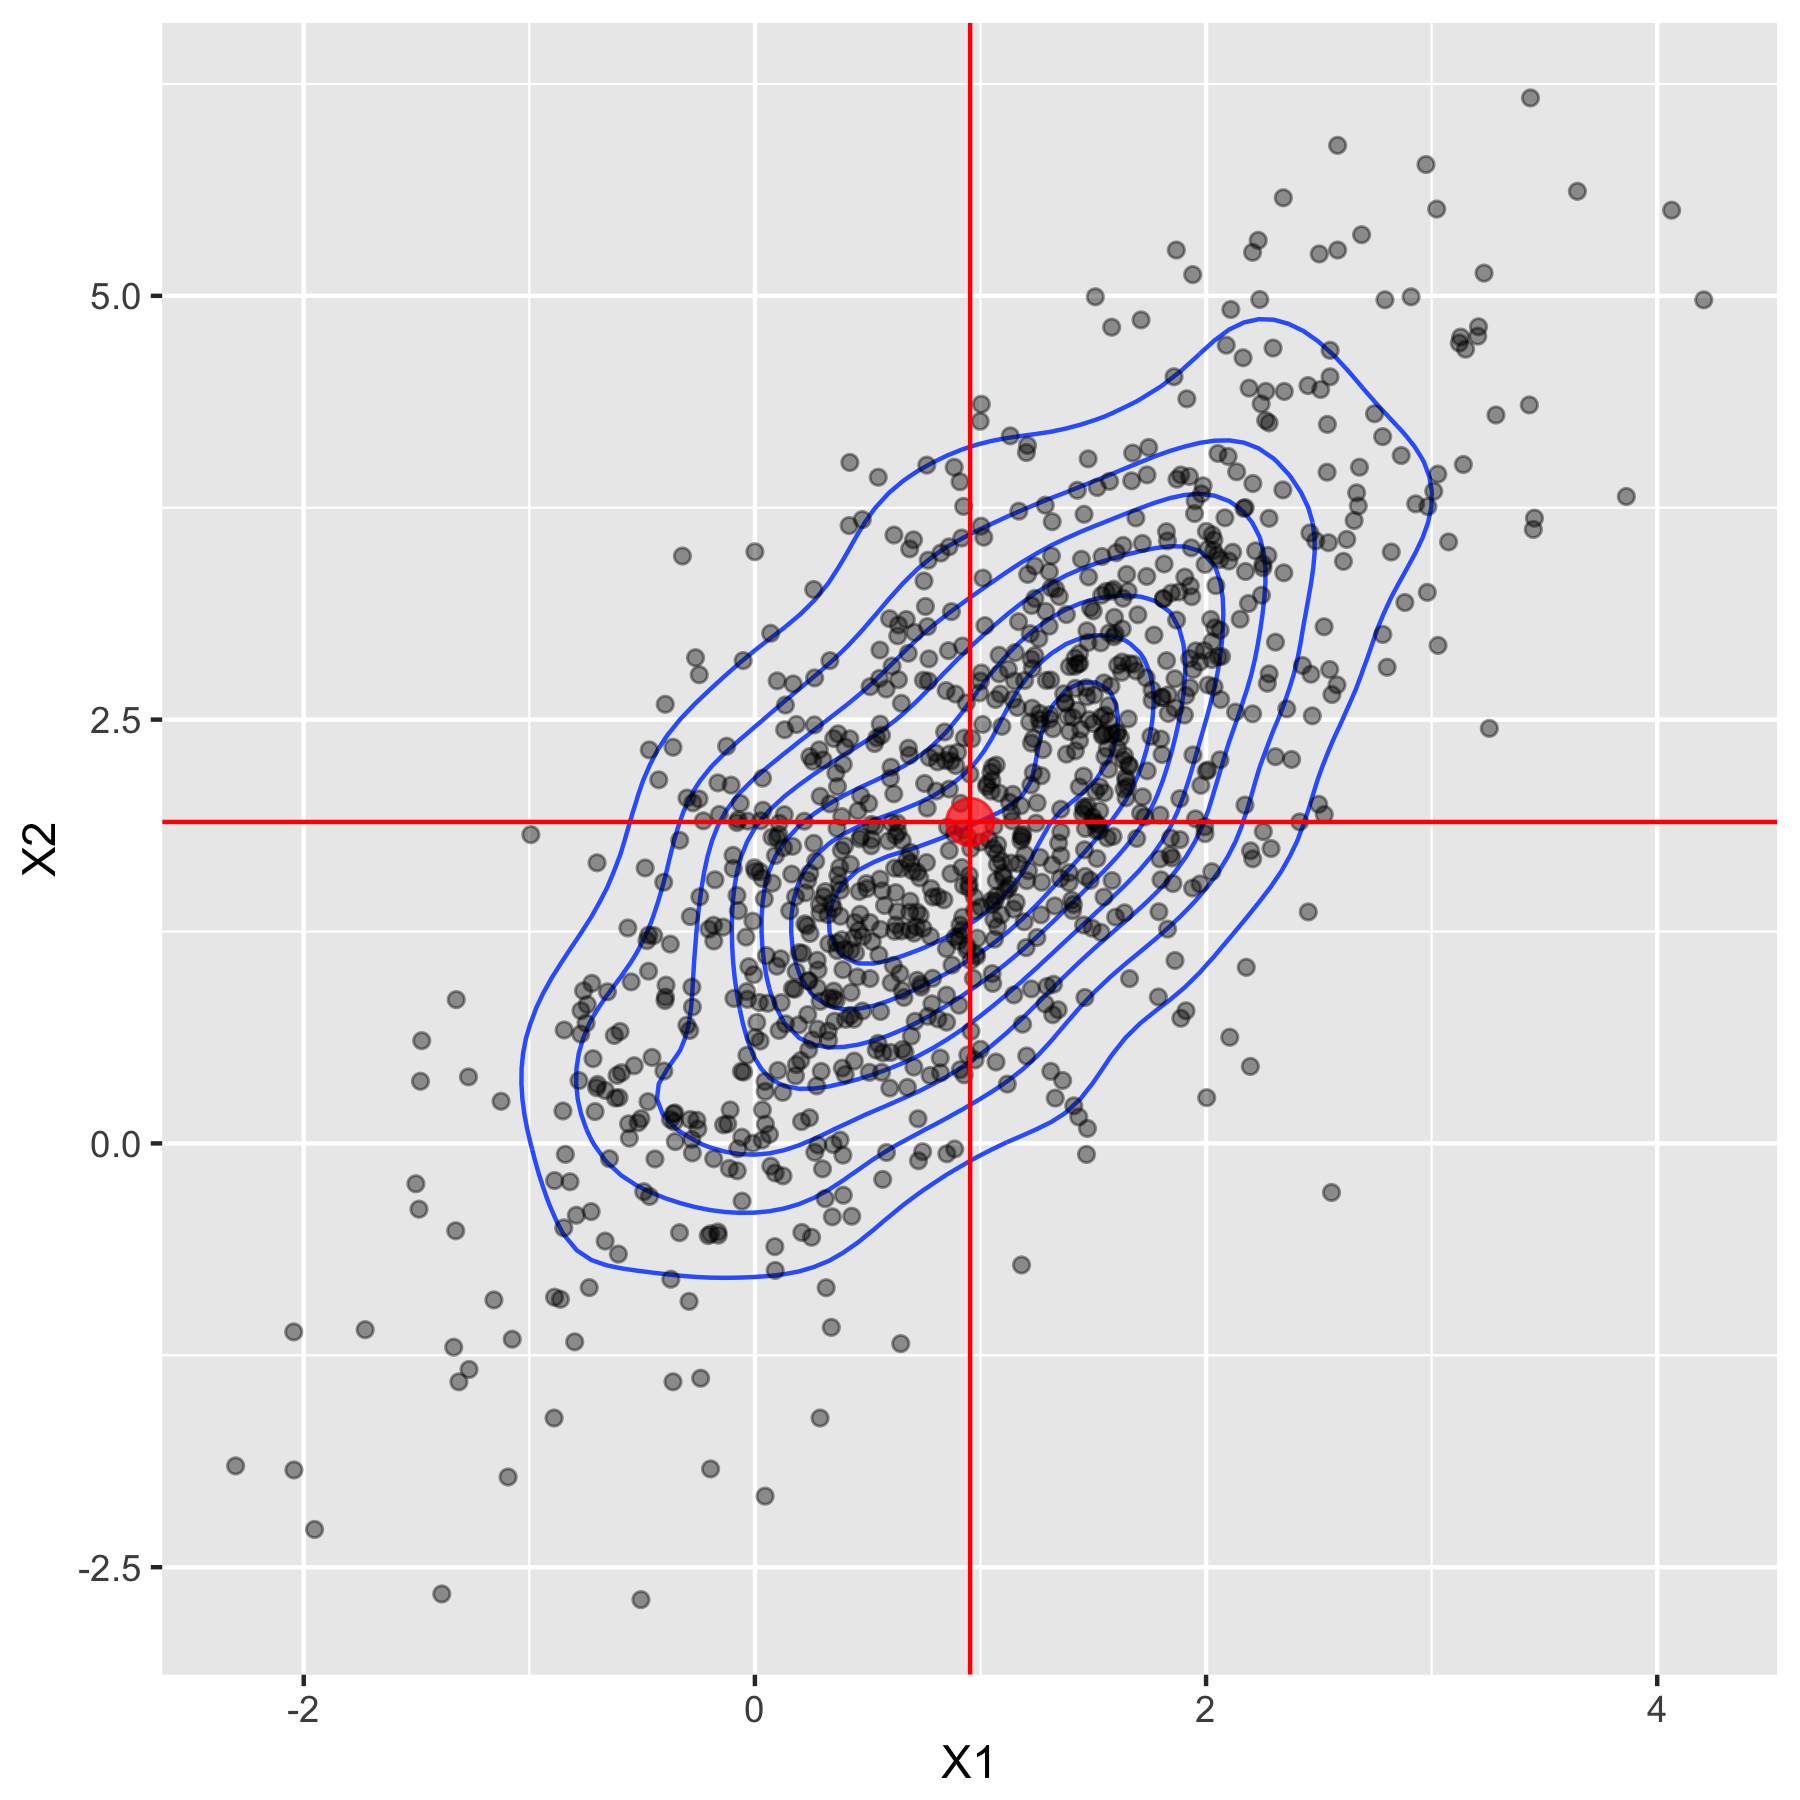
                                  Mean vector (0.95 1.89)

Phân phối Xác suất Đa biến trong R

Variance-covariance matrix is the spread
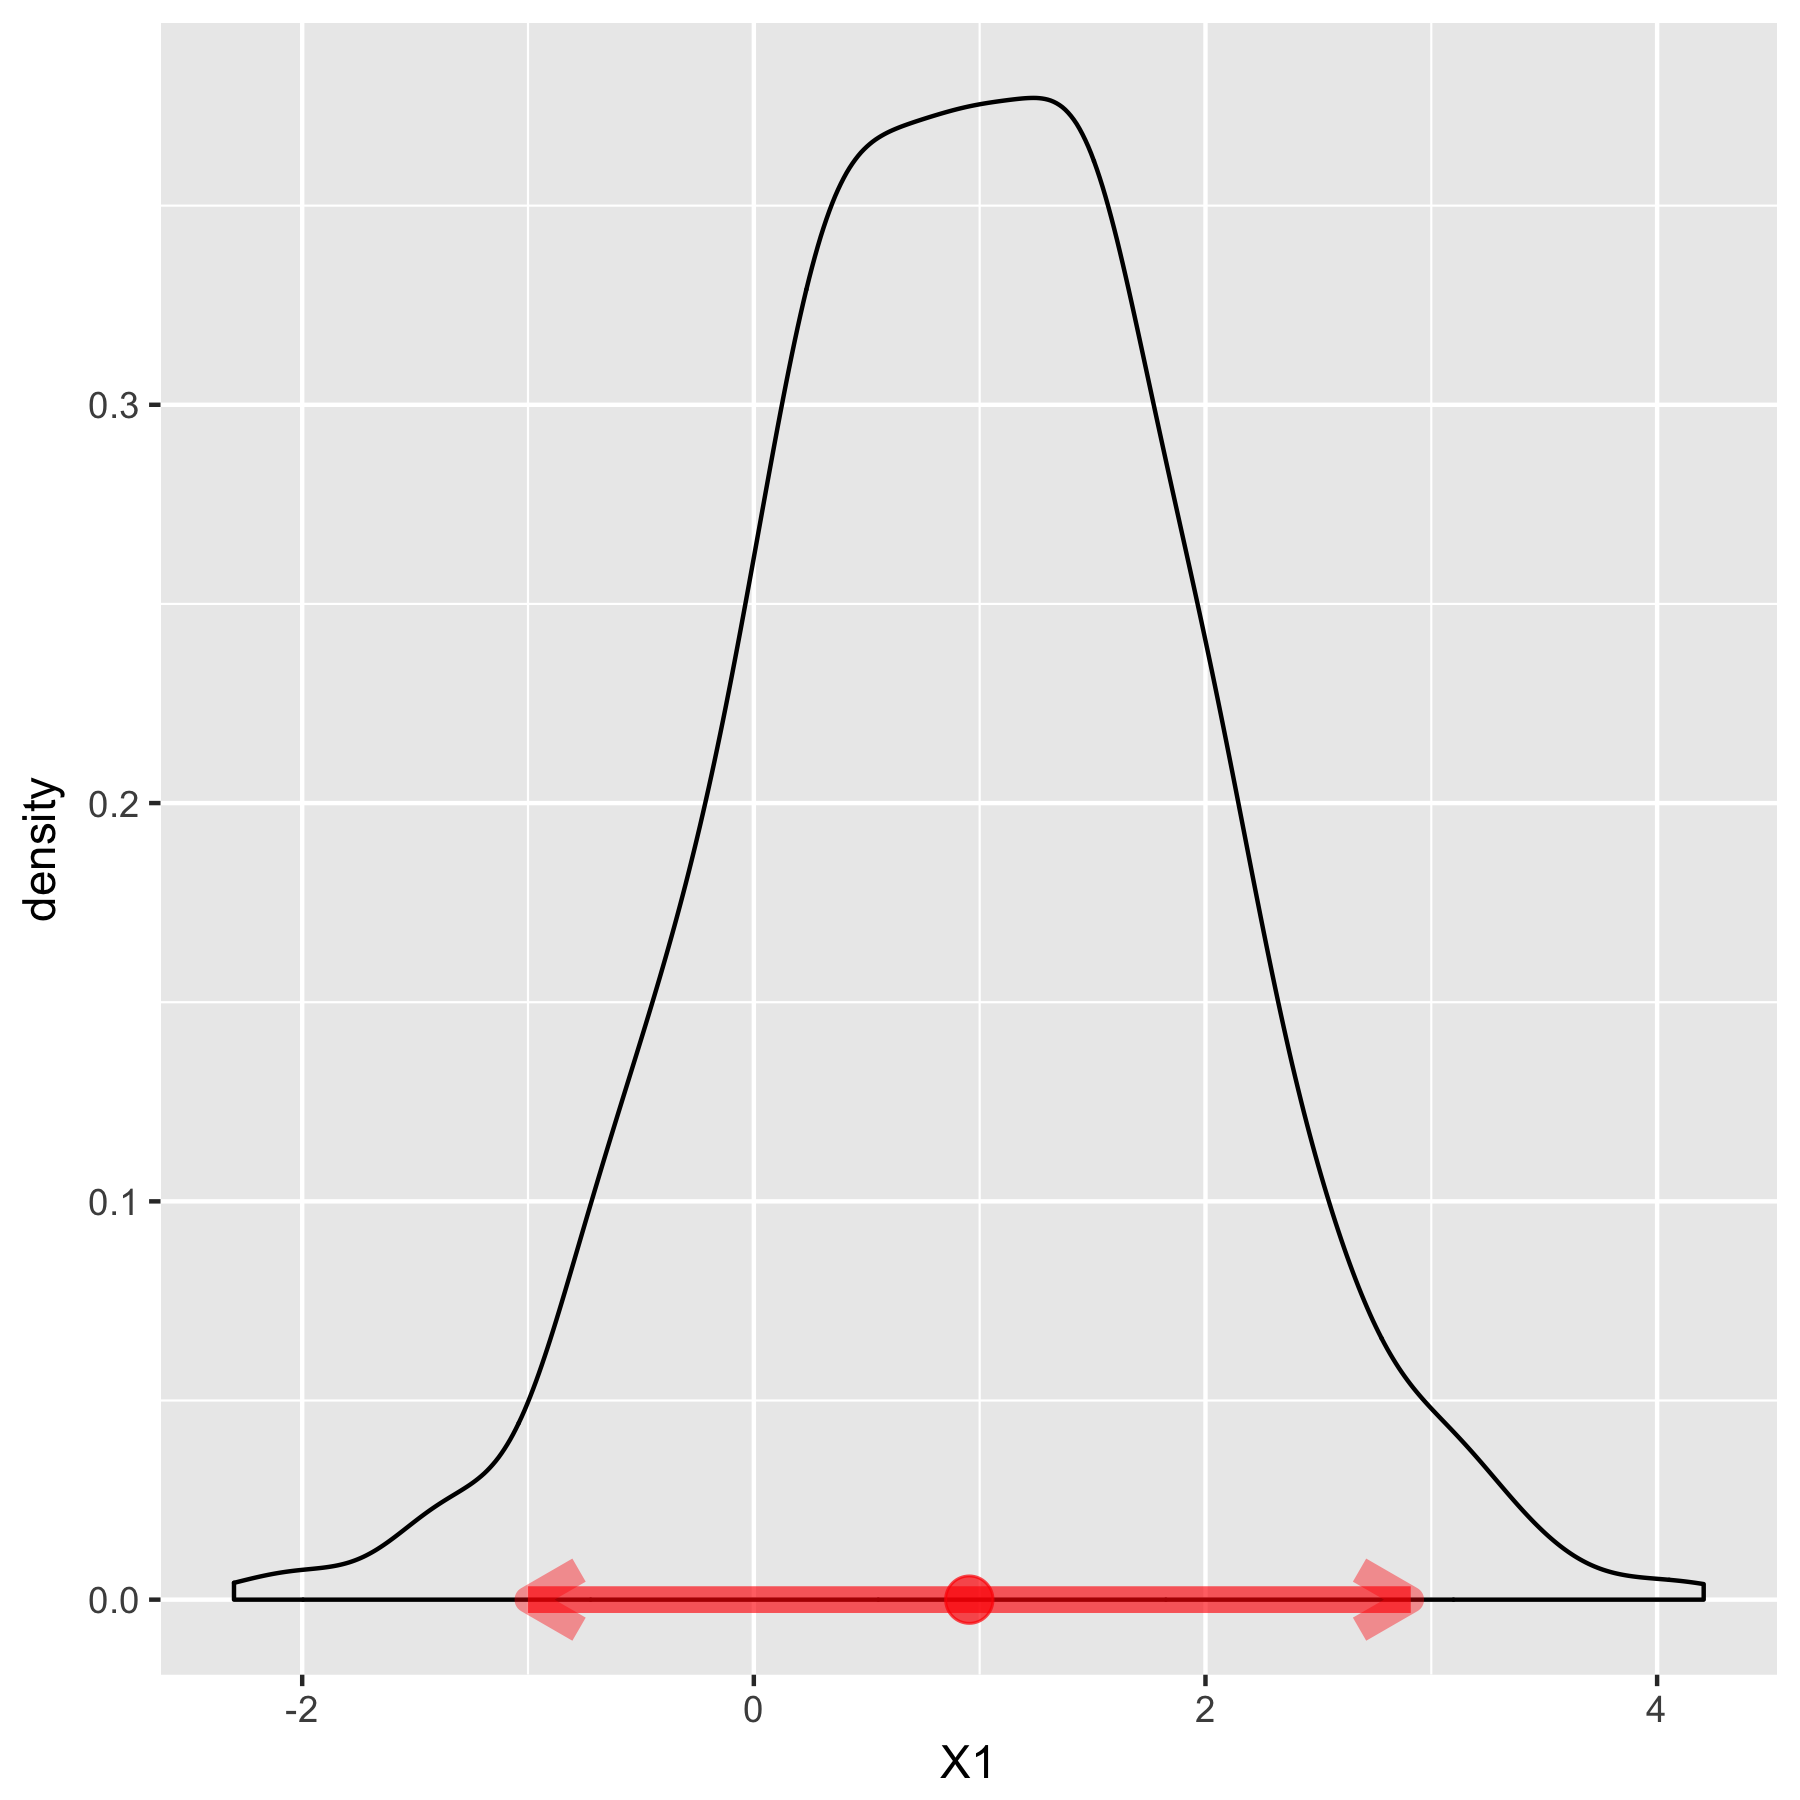
                                            Variance $1.02$

Variance-covariance ${\begin{pmatrix} 1.02 & 0.97 \\ 0.97 & 2 \end{pmatrix}}$

Phân phối Xác suất Đa biến trong R

Calculating the mean

colMeans(iris_raw[, 1:4])
Sepal.Length  Sepal.Width Petal.Length  Petal.Width 
        5.84         3.05         3.76         1.20

Functions that calculate means by subgroups

  • by()
  • aggregate()
Phân phối Xác suất Đa biến trong R

Calculating the group mean using by

by(data = iris[,1:4], INDICES = iris$Species, FUN = colMeans)
iris_raw$Species: setosa
Sepal.Length  Sepal.Width Petal.Length  Petal.Width 
       5.006        3.418        1.464        0.244 
 ----------------------------------------------------
iris_raw$Species: versicolor
Sepal.Length  Sepal.Width Petal.Length  Petal.Width 
       5.936        2.770        4.260        1.326 
 ----------------------------------------------------
iris_raw$Species: virginica
Sepal.Length  Sepal.Width Petal.Length  Petal.Width 
       6.588        2.974        5.552        2.026
Phân phối Xác suất Đa biến trong R

Calculating the group mean using aggregate

aggregate(. ~ Species, iris_raw, mean)
     Species Sepal.Length Sepal.Width Petal.Length Petal.Width
1     setosa         5.01        3.42         1.46       0.244
2 versicolor         5.94        2.77         4.26       1.326
3  virginica         6.59        2.97         5.55       2.026
Phân phối Xác suất Đa biến trong R

Calculating the variance-covariance and correlation matrices

var(iris_raw[, 1:4])
             Sepal.Length Sepal.Width Petal.Length Petal.Width
Sepal.Length       0.6857     -0.0393        1.274       0.517
Sepal.Width       -0.0393      0.1880       -0.322      -0.118
Petal.Length       1.2737     -0.3217        3.113       1.296
Petal.Width        0.5169     -0.1180        1.296       0.582

Correlation

cor(iris_raw[, 1:4])
             Sepal.Length Sepal.Width Petal.Length Petal.Width
Sepal.Length        1.000      -0.109        0.872       0.818
Sepal.Width        -0.109       1.000       -0.421      -0.357
Petal.Length        0.872      -0.421        1.000       0.963
Petal.Width         0.818      -0.357        0.963       1.000
Phân phối Xác suất Đa biến trong R

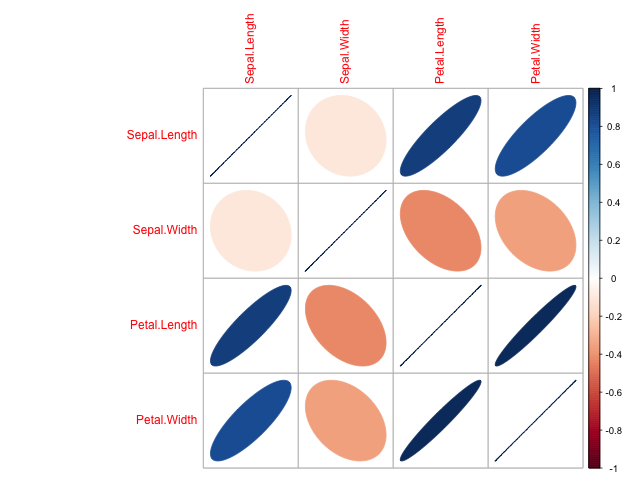
Visualization of correlation matrix

corrplot function to visualize correlation plot

corrplot(cor(iris_raw[, 1:4]), method = "ellipse")
Phân phối Xác suất Đa biến trong R

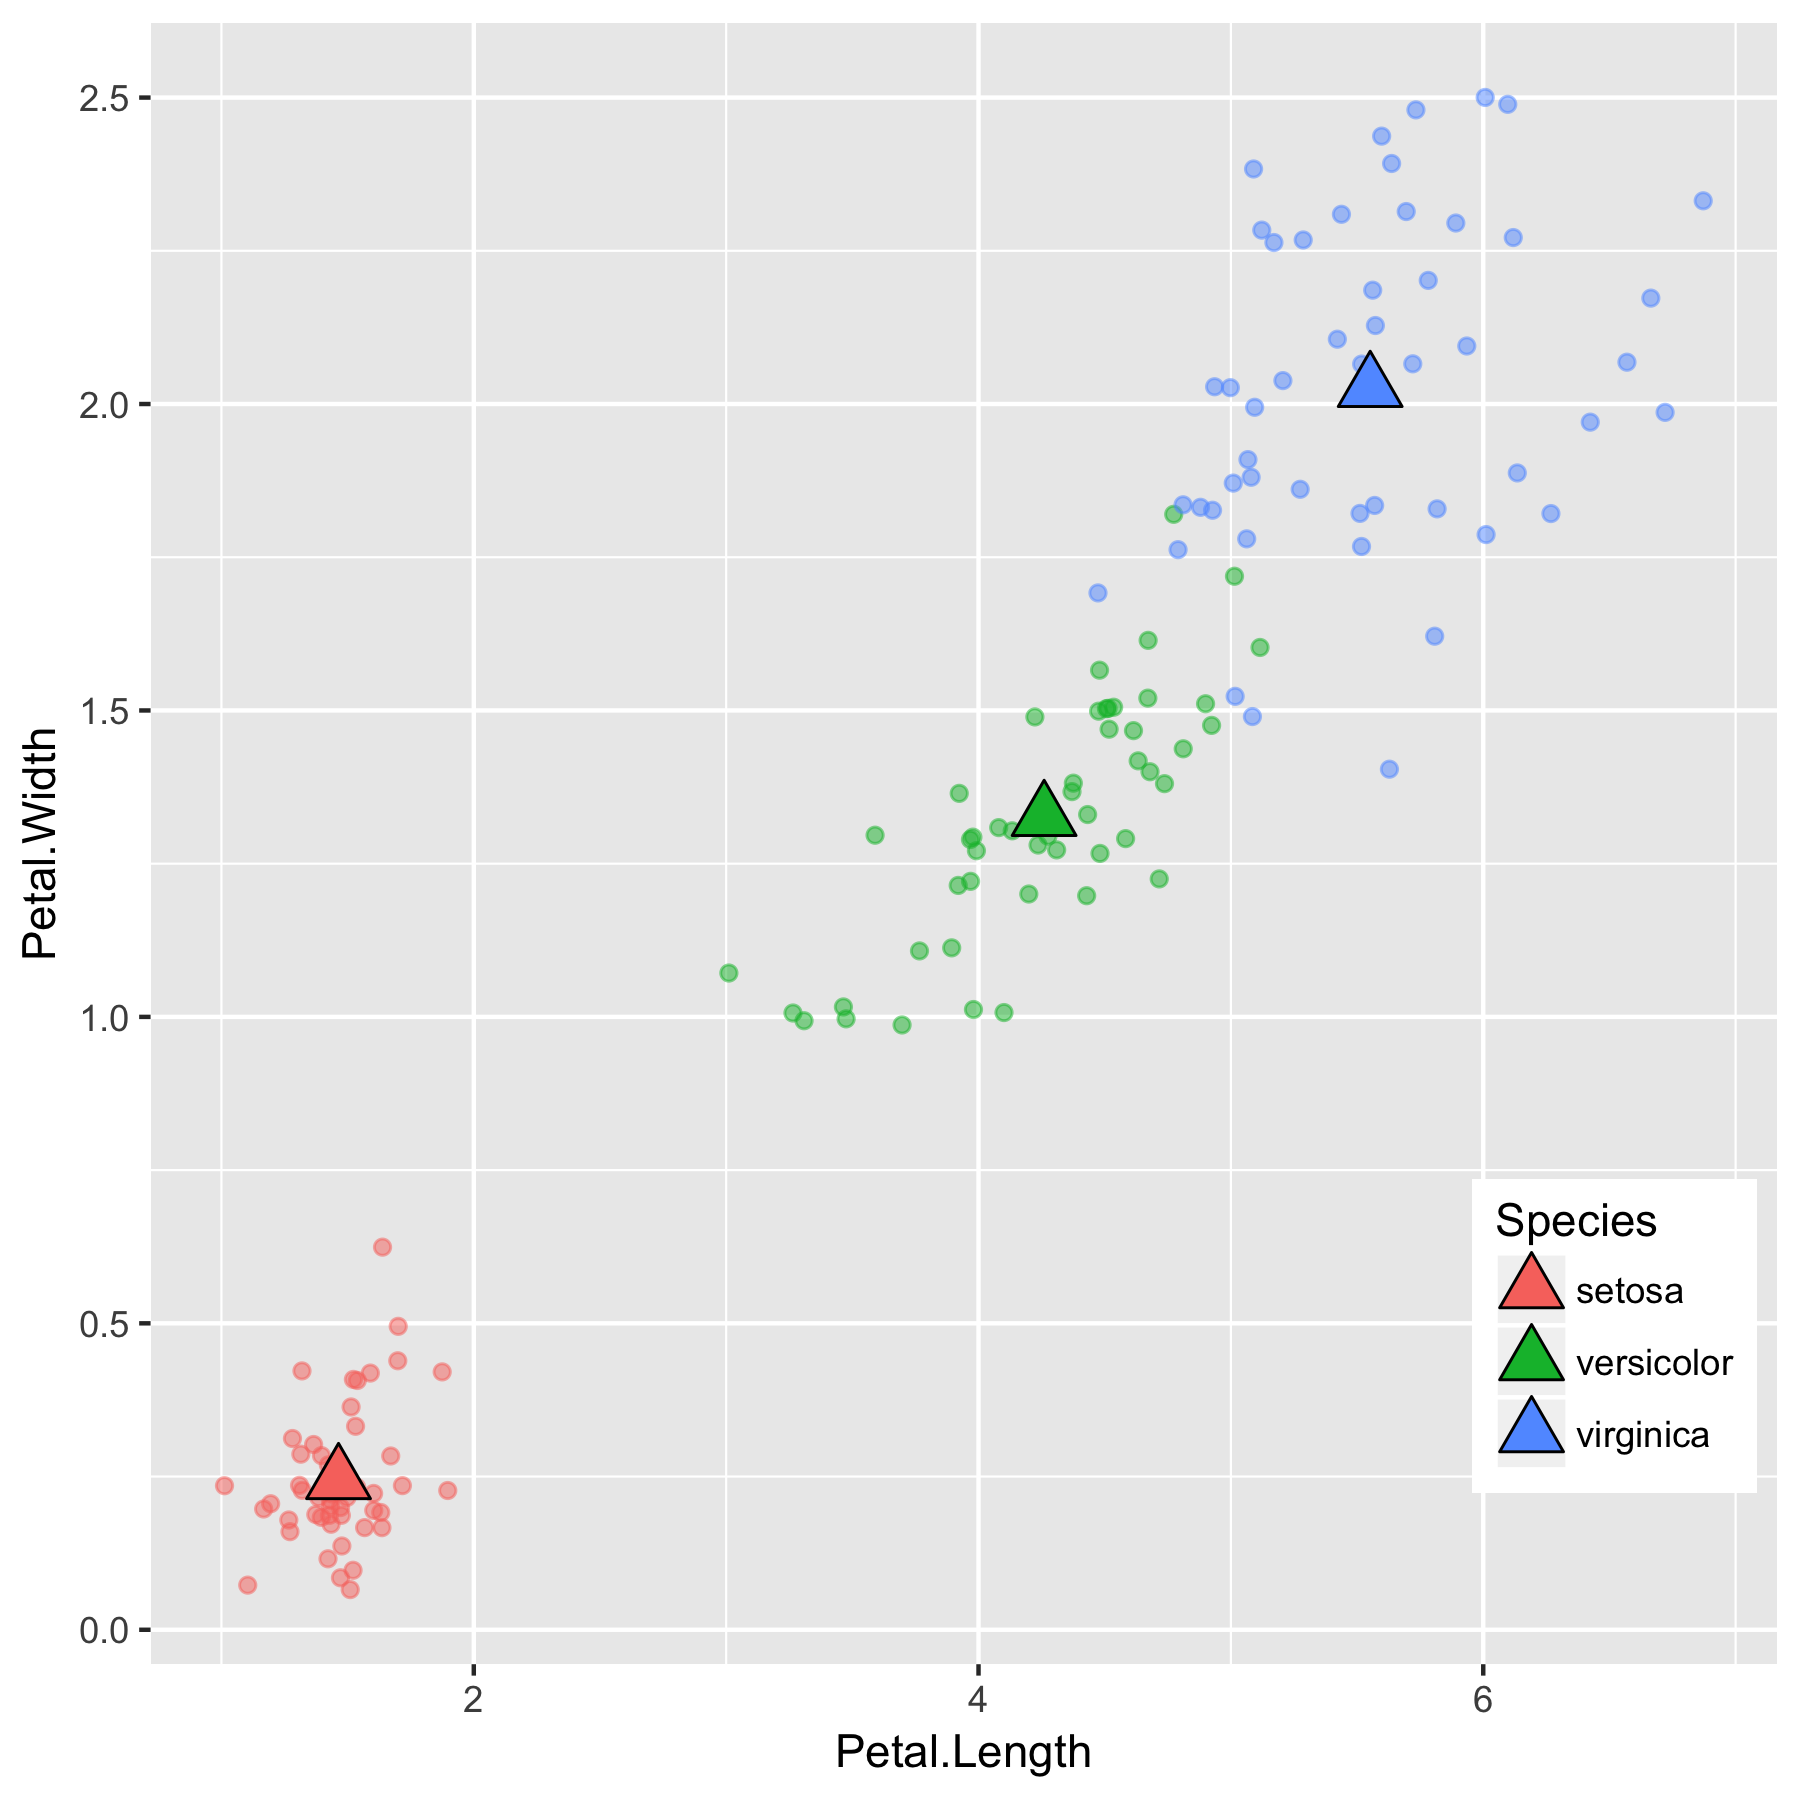
Interpretation of means

Means

Species Petal.Length Petal.Width
setosa 1.46 0.244
versicolor 4.26 1.326
virginica 5.55 2.026

mean

Phân phối Xác suất Đa biến trong R

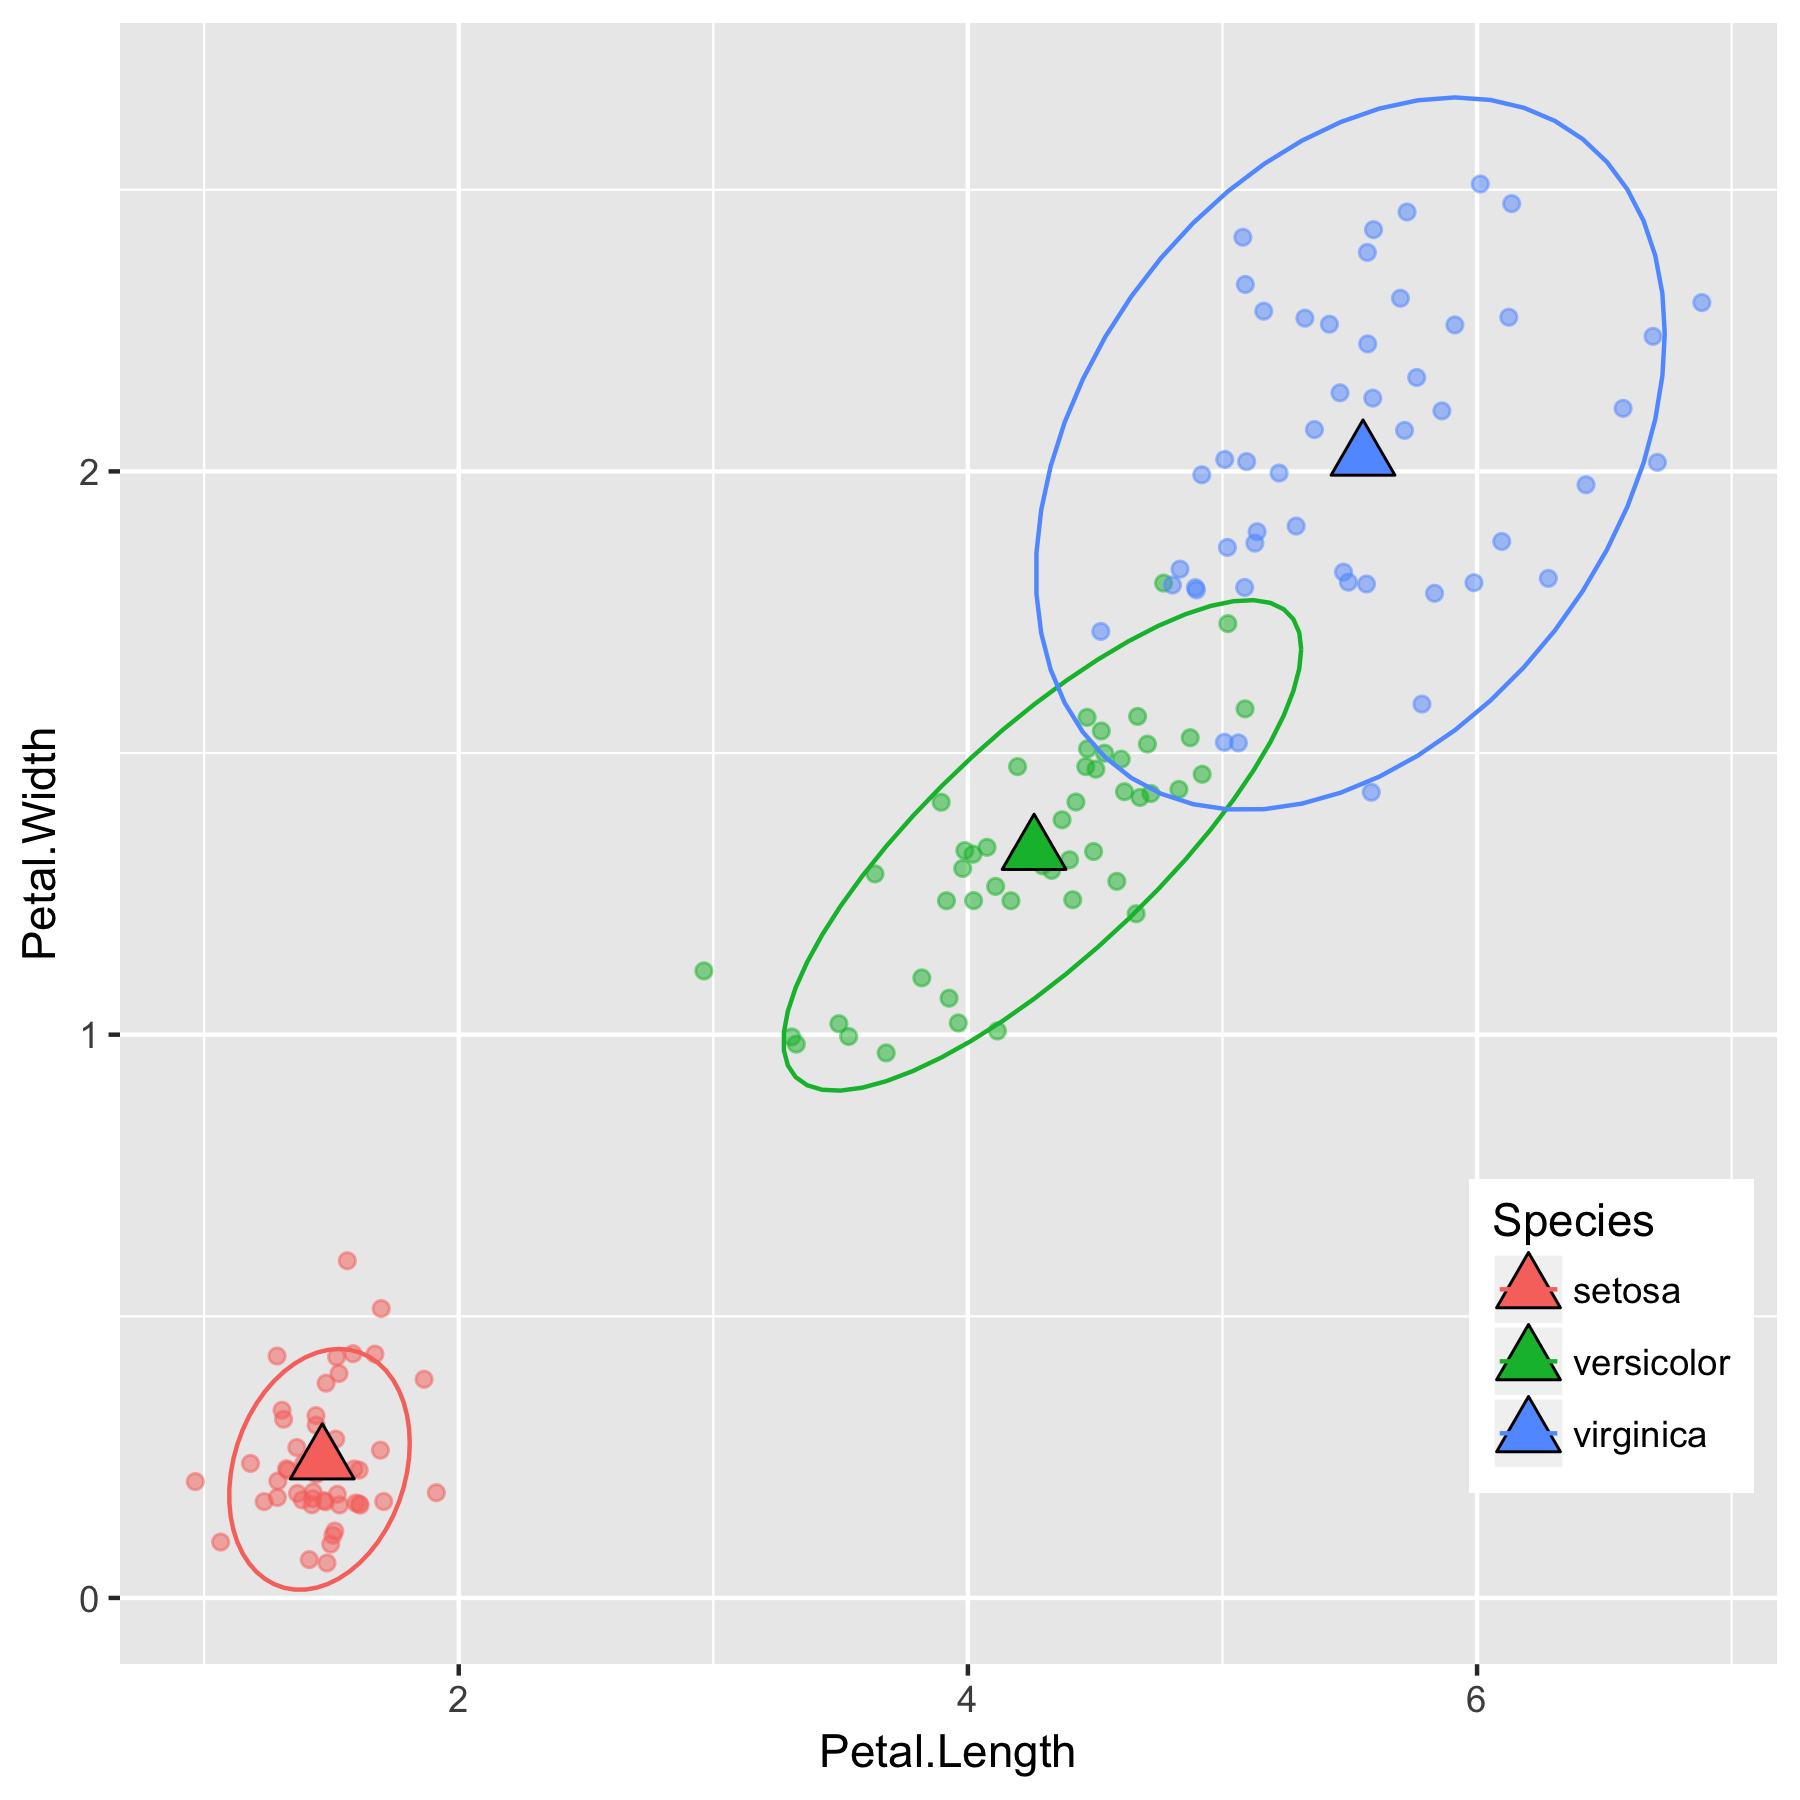
Interpretation of variances

setosa Petal.Length Petal.Width
Petal.Length 0.030 0.006
Petal.Width 0.006 0.011
versicolor Petal.Length Petal.Width
Petal.Length 0.221 0.073
Petal.Width 0.073 0.039
virginica Petal.Length Petal.Width
Petal.Length 0.305 0.049
Petal.Width 0.049 0.075

mean and variance

Phân phối Xác suất Đa biến trong R

Let's practice!

Phân phối Xác suất Đa biến trong R

Preparing Video For Download...