Làm biểu đồ “shiny” hơn

Trực quan hóa dữ liệu tương tác nâng cao với plotly trong R

Adam Loy

Statistician, Carleton College

Ứng dụng không cần shiny
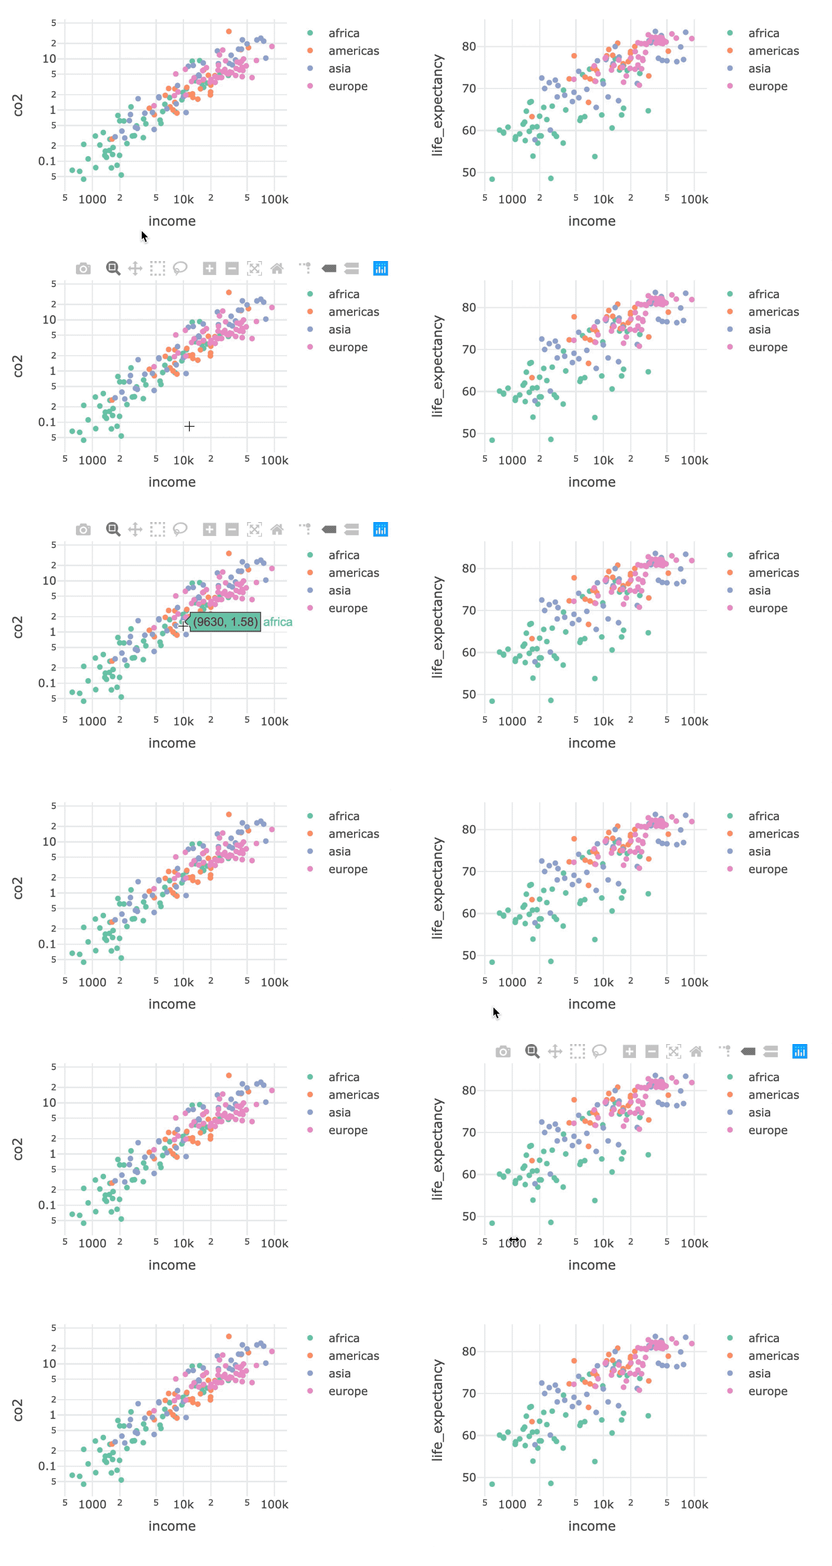
Ví dụ bscols

Trực quan hóa dữ liệu tương tác nâng cao với plotly trong R

bscols() cho bố cục cột

library(plotly)
library(crosstalk)
shared_data <- world2014 %>% SharedData$new()

p1 <- shared_data %>% plot_ly(x=~income, y = ~co2, color = ~four_regions) %>% add_markers() %>% layout(xaxis = list(type = "log"), yaxis = list(type = "log")) p2 <- shared_data %>% plot_ly(x=~income, y = ~life_expectancy, color = ~four_regions) %>% add_markers() %>% layout(xaxis = list(type = "log")))
bscols(p1, p2)
Trực quan hóa dữ liệu tương tác nâng cao với plotly trong R

bscols() cho bố cục cột

bscols bước 1

Trực quan hóa dữ liệu tương tác nâng cao với plotly trong R

Thêm bộ lọc: Hộp kiểm

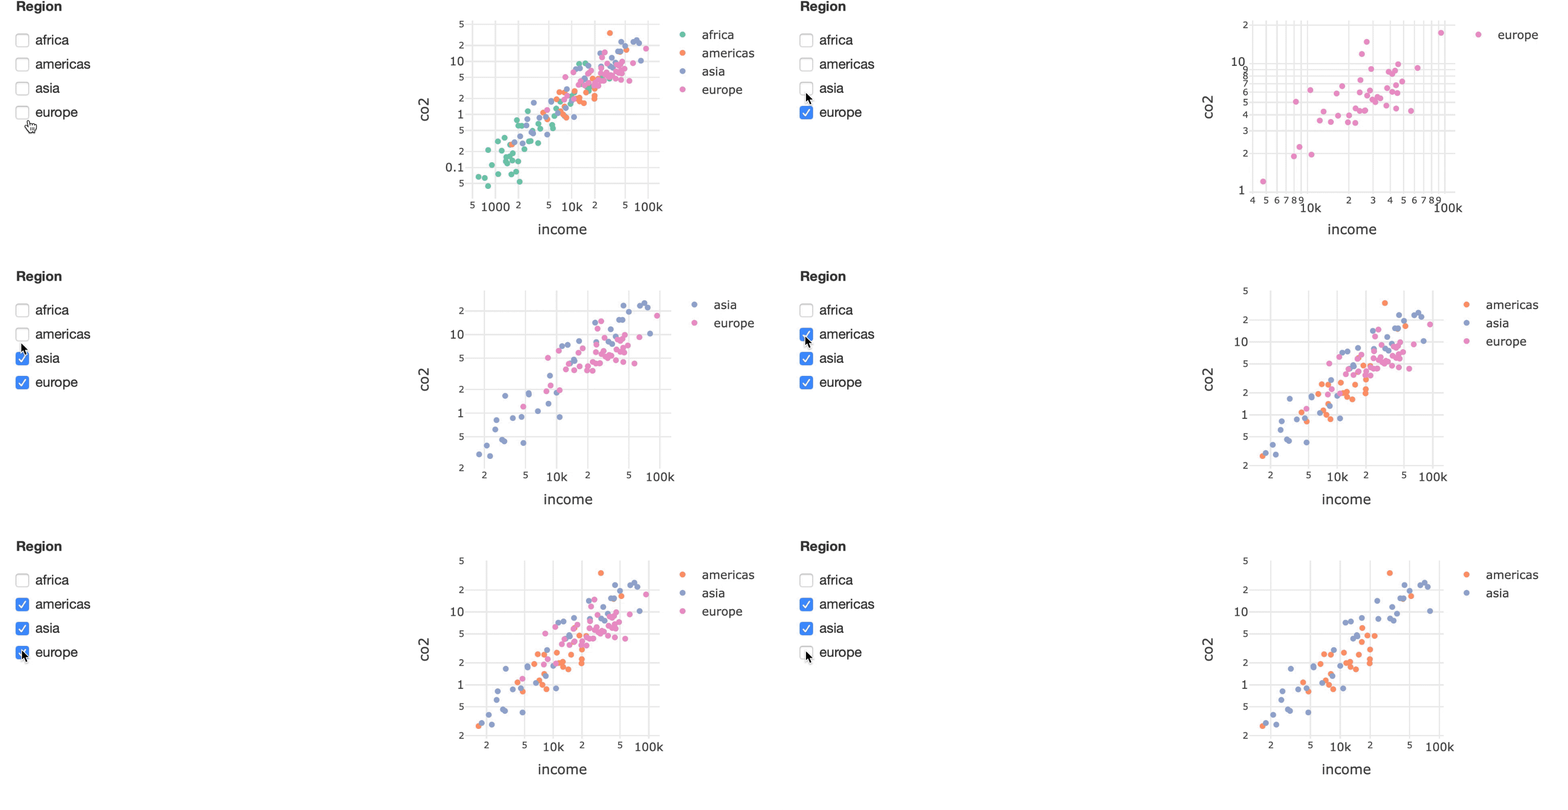
Hộp kiểm trong bscols

bscols(filter_checkbox(id = "four_regions", label = "Region", 
                       sharedData = shared_data, group = ~four_regions),
       p1)
Trực quan hóa dữ liệu tương tác nâng cao với plotly trong R

Thêm bộ lọc: Hộp chọn

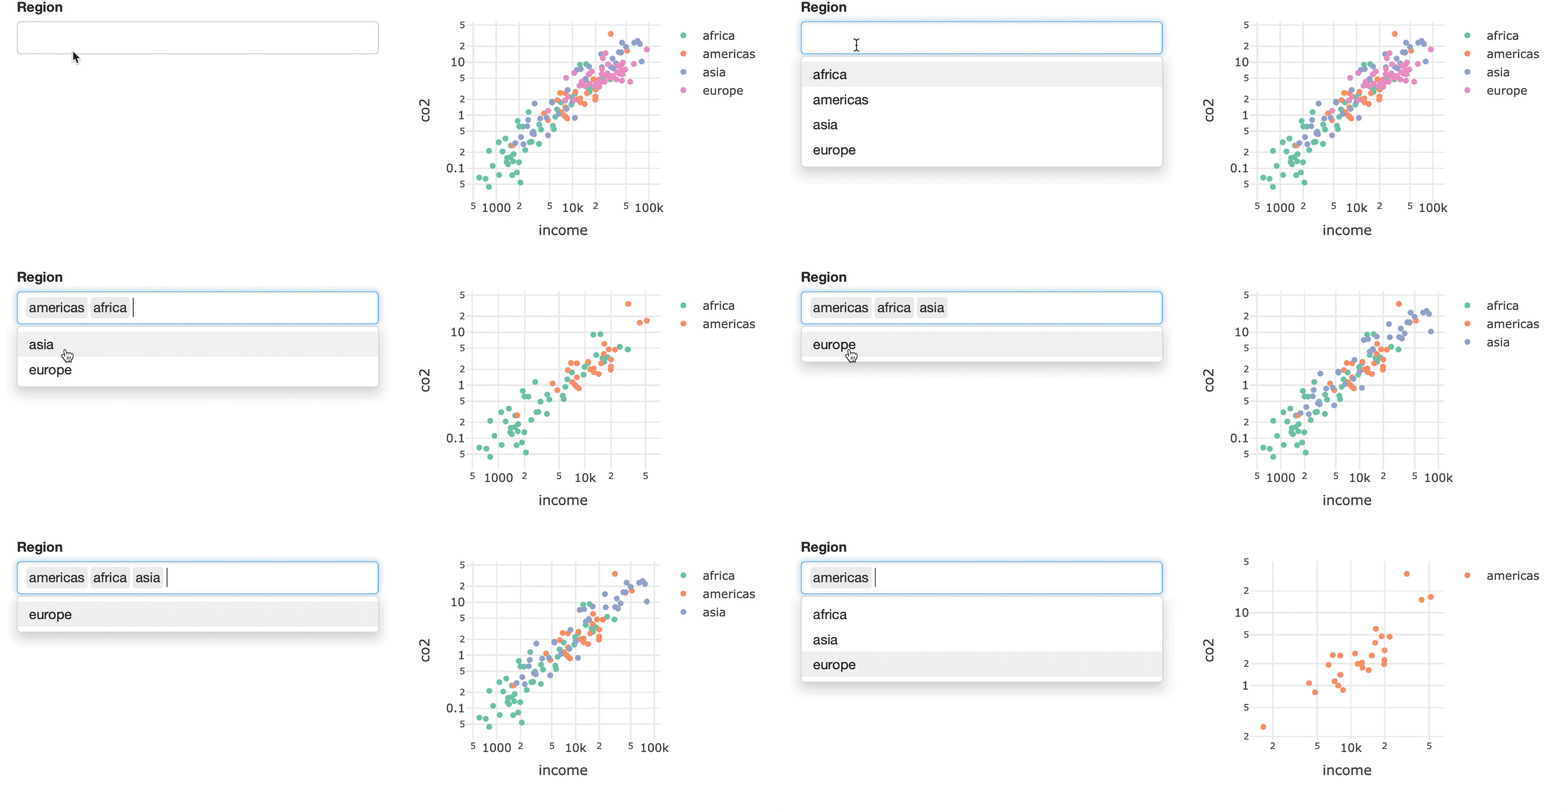
Hộp chọn trong bscols

bscols(filter_select(id = "four_regions", label = "Region", 
                sharedData = shared_data, group = ~four_regions),
       p1)
Trực quan hóa dữ liệu tương tác nâng cao với plotly trong R

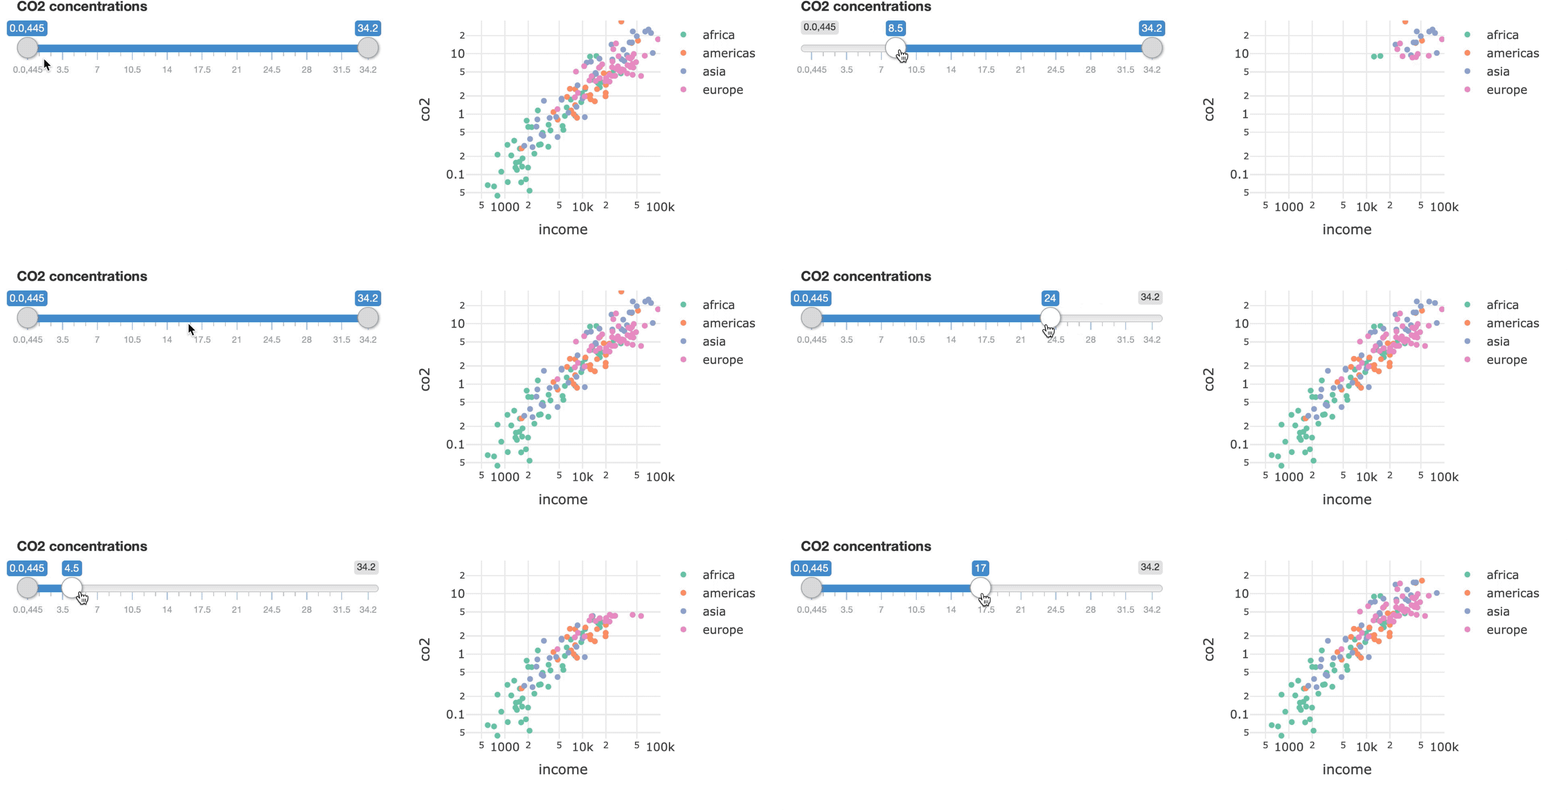
Thêm bộ lọc: Thanh trượt

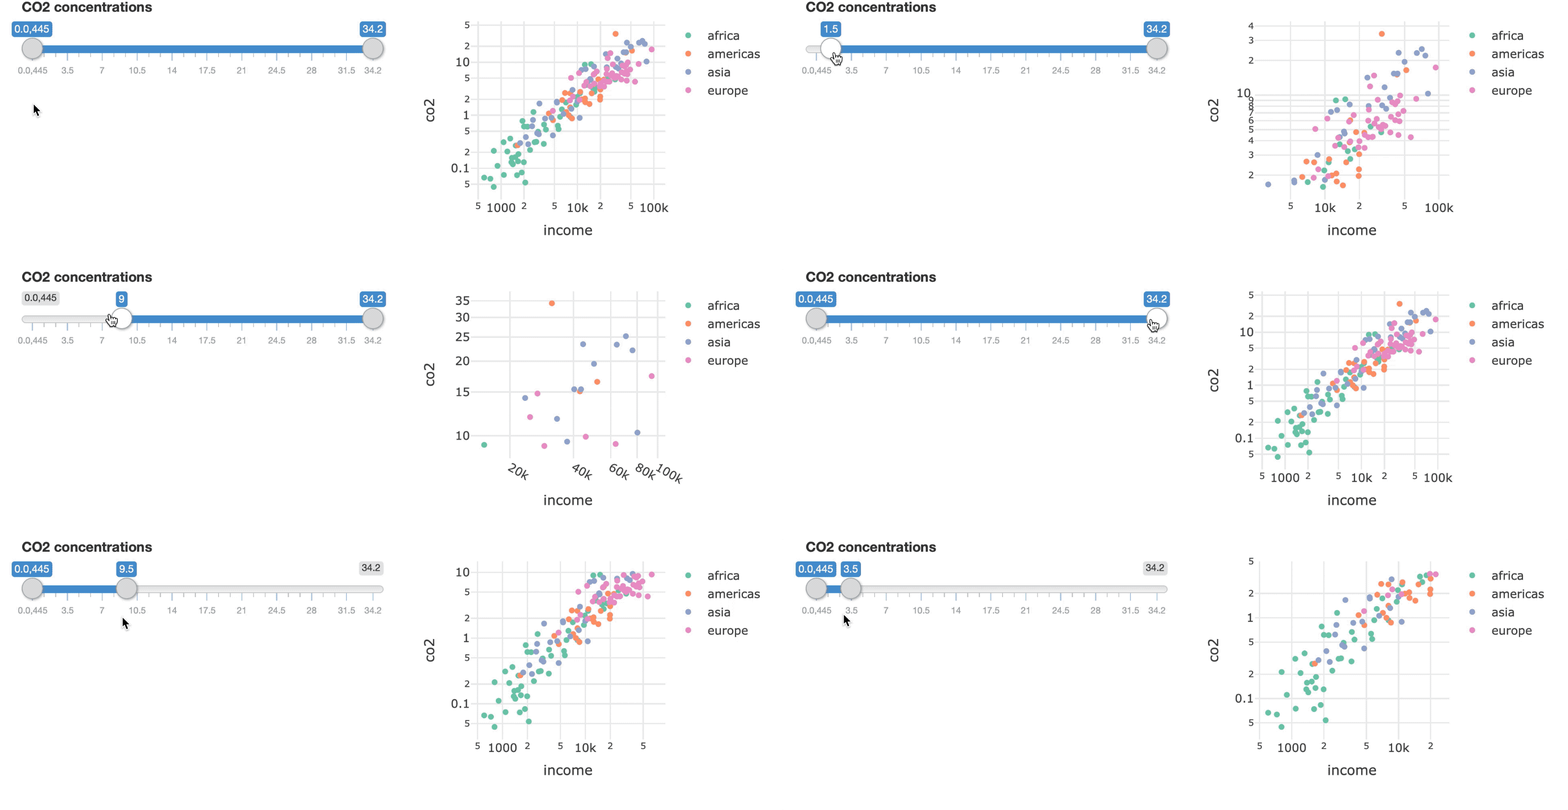
Thanh trượt trong bscols

bscols(filter_slider(id = "co2", label = "CO2 concentrations", 
                     sharedData = shared_data, column = ~co2),
       p1)
Trực quan hóa dữ liệu tương tác nâng cao với plotly trong R

Cố định khoảng trục

Cố định khoảng trục trong bscols

bscols(filter_slider(id = "co2", label = "CO2 concentrations", 
                     sharedData = shared_data, column = ~co2),
        p1 %>% layout(xaxis = list(range = c(2.5, 5)), 
                      yaxis = list(range = c(-1.4, 1.55)))
)
Trực quan hóa dữ liệu tương tác nâng cao với plotly trong R

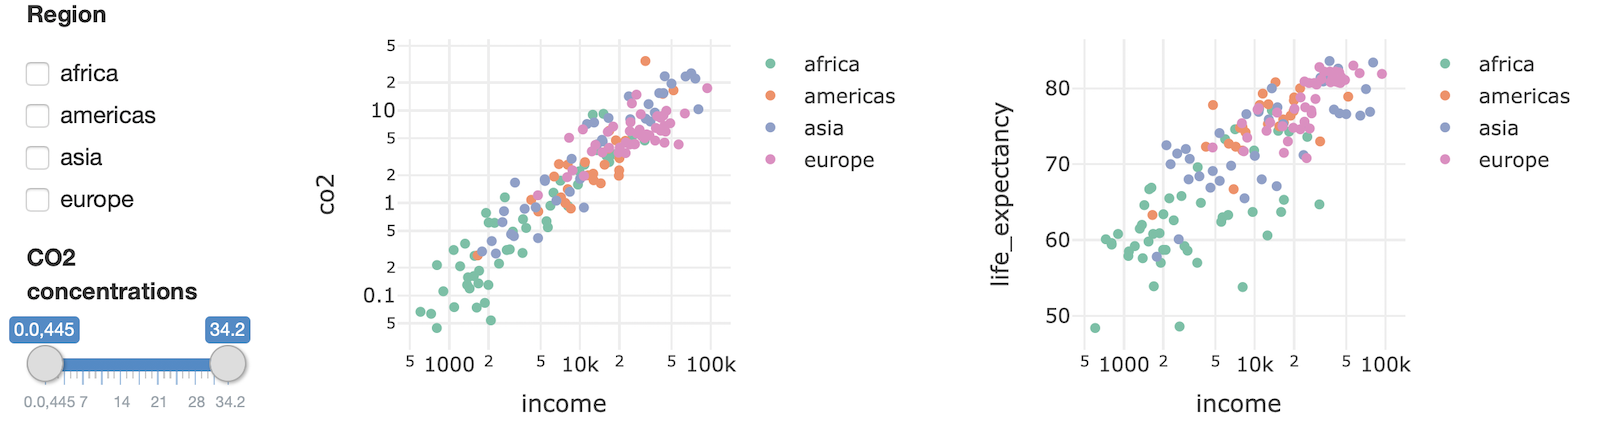
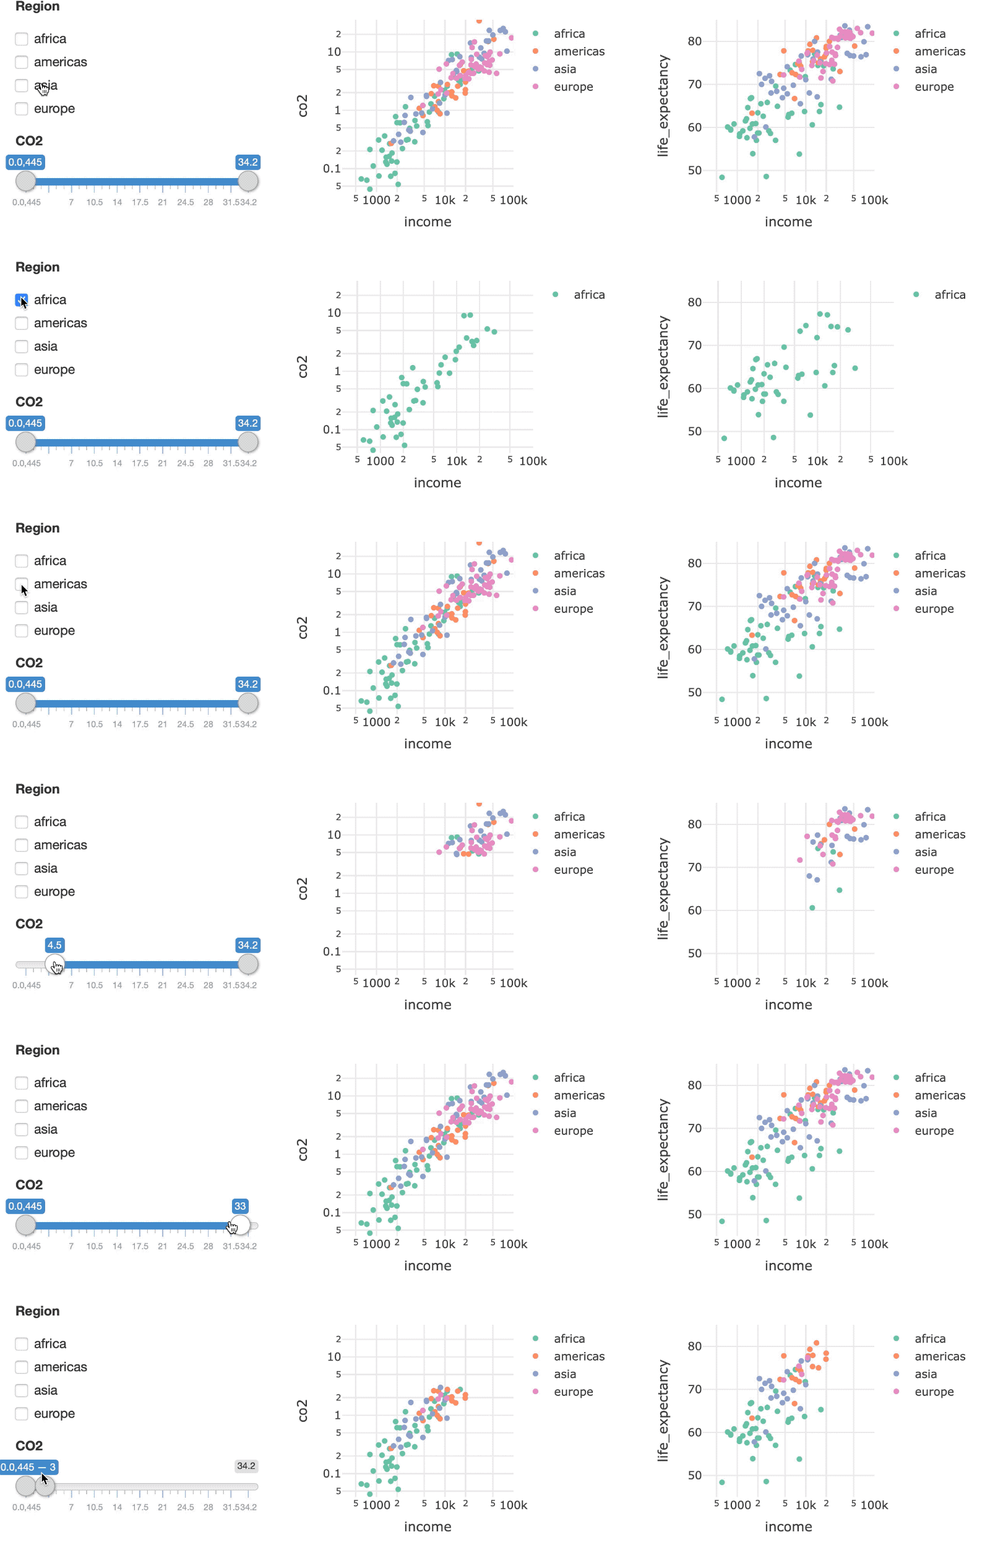
Ghép các phần lại với nhau

bscols(widths = c(2, 5, 5),
  list(
    filter_checkbox(
      id = "four_regions", label = "Region", 
      sharedData = shared_data, group = ~four_regions
    ),
    filter_slider(
      id = "co2", label = "CO2 concentrations", 
      sharedData = shared_data, column = ~co2
    )
  ),
  p1,
  p2
)
Trực quan hóa dữ liệu tương tác nâng cao với plotly trong R

Ghép các phần lại với nhau

Kết quả bscols (tĩnh)

Trực quan hóa dữ liệu tương tác nâng cao với plotly trong R

Hãy thực hành!

Trực quan hóa dữ liệu tương tác nâng cao với plotly trong R

Preparing Video For Download...