Chuẩn hóa và lọc

Phân tích Biểu hiện khác biệt với limma trong R

John Blischak

Instructor

Các bước tiền xử lý

  • Biến đổi log

  • Chuẩn hóa theo phân vị (quantile)

  • Lọc

Phân tích Biểu hiện khác biệt với limma trong R

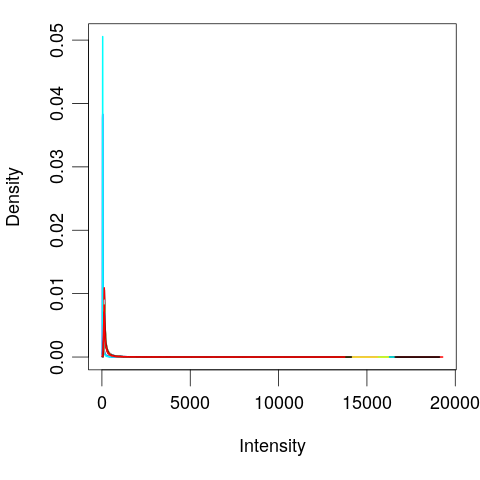
Trực quan hóa

library(limma)

# Plot distribution of each sample
plotDensities(eset, legend = FALSE)

Phân tích Biểu hiện khác biệt với limma trong R

Biến đổi log

100 - 1
.1 - .001
99
0.099
log(100) - log(1)
4.60517
log(.1) - log(.001)
4.60517
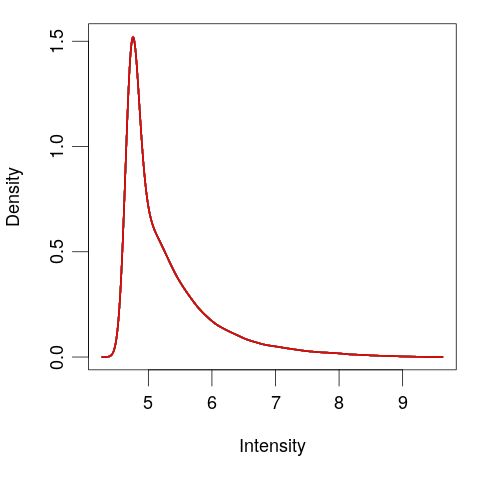
# Log tranform
exprs(eset) <- log(exprs(eset))
plotDensities(eset, legend = FALSE)
Phân tích Biểu hiện khác biệt với limma trong R

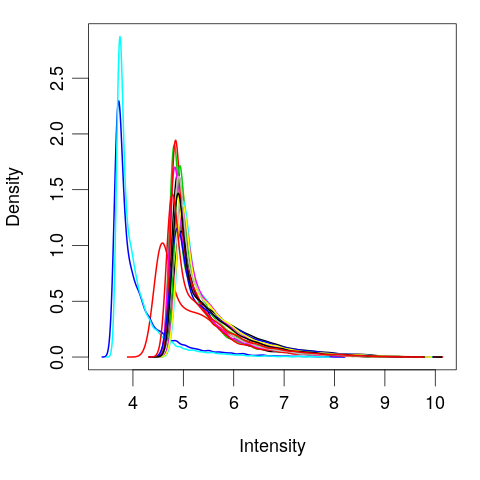
Chuẩn hóa theo phân vị

# Quantile normalize
exprs(eset) <- normalizeBetweenArrays(exprs(eset))

plotDensities(eset, legend = FALSE)

Phân tích Biểu hiện khác biệt với limma trong R

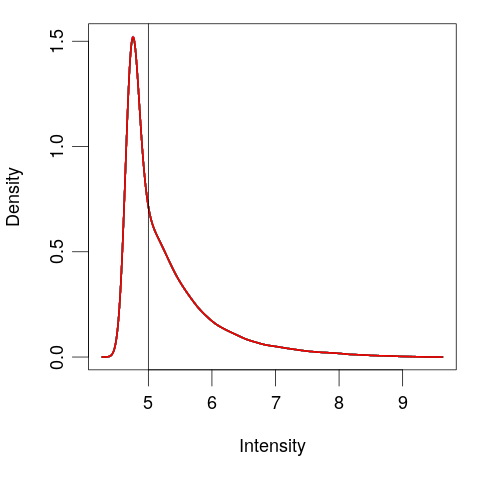
Lọc gene

# View the normalized data
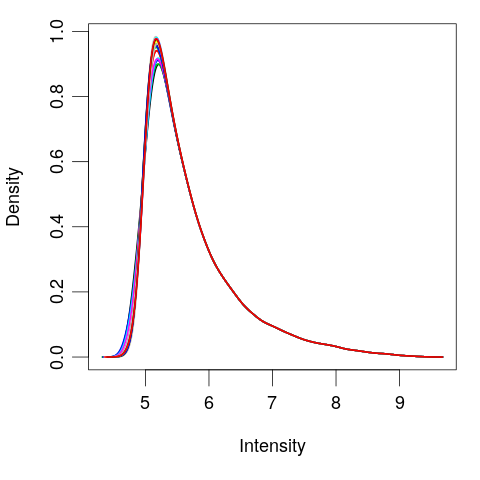
plotDensities(eset, legend = FALSE)
abline(v = 5)
# Create logical vector
keep <- rowMeans(exprs(eset)) > 5
# Filter the genes
eset <- eset[keep, ]
plotDensities(eset, legend = FALSE)
Phân tích Biểu hiện khác biệt với limma trong R

Cùng luyện tập nào!

Phân tích Biểu hiện khác biệt với limma trong R

Preparing Video For Download...