Trực quan hóa sai số biên trong ACS

Phân tích dữ liệu Điều tra Dân số Hoa Kỳ bằng R

Kyle Walker

Instructor

Trực quan hóa độ bất định

  • Cách làm phổ biến: biểu đồ thanh sai số
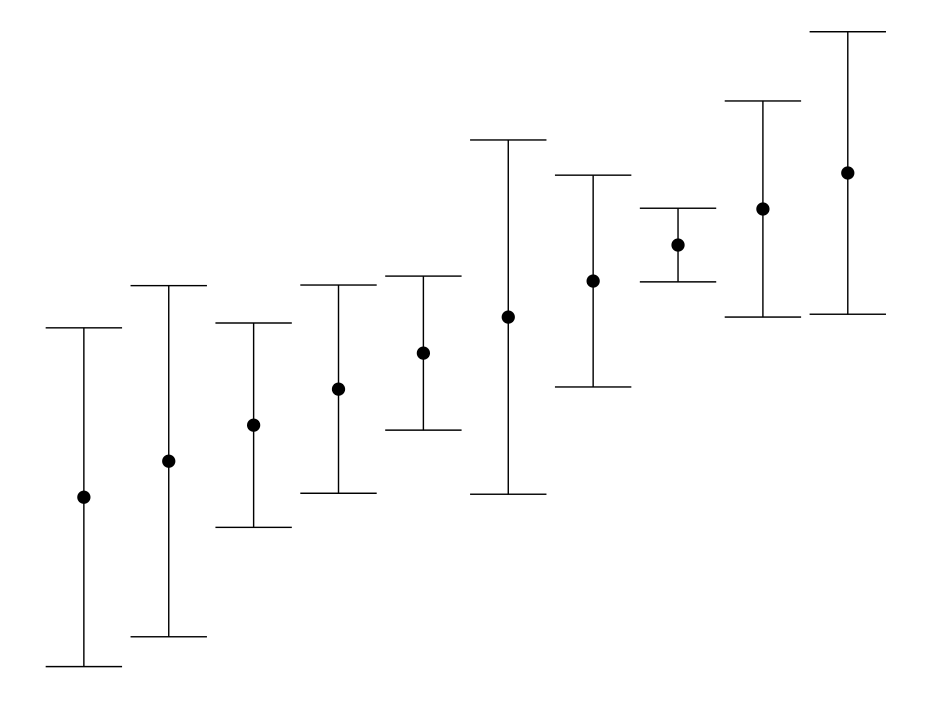
Ví dụ biểu đồ thanh sai số

Phân tích dữ liệu Điều tra Dân số Hoa Kỳ bằng R

Biểu đồ sai số biên trong ggplot2

  • Trong ggplot2: geom_errorbar()geom_errorbarh()
library(tidycensus)
library(tidyverse)

wyoming_age <- get_acs(geography = "county", 
                       variables = c(medianage = "B01002_001"), 
                       state = "WY")  

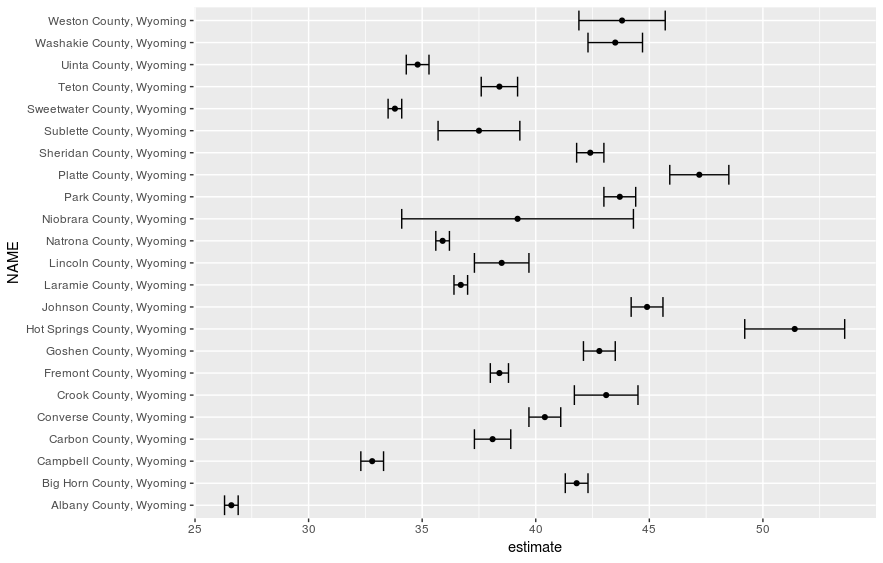
ggplot(wyoming_age, aes(x = estimate, y = NAME)) + 
  geom_errorbarh(aes(xmin = estimate - moe, 
                     xmax = estimate + moe)) + 
  geom_point()
Phân tích dữ liệu Điều tra Dân số Hoa Kỳ bằng R

biểu đồ sai số biên chưa định dạng

Phân tích dữ liệu Điều tra Dân số Hoa Kỳ bằng R

Định dạng biểu đồ sai số biên

wyoming_age2 <- wyoming_age %>%
  mutate(NAME = str_replace(NAME, " County, Wyoming", ""))

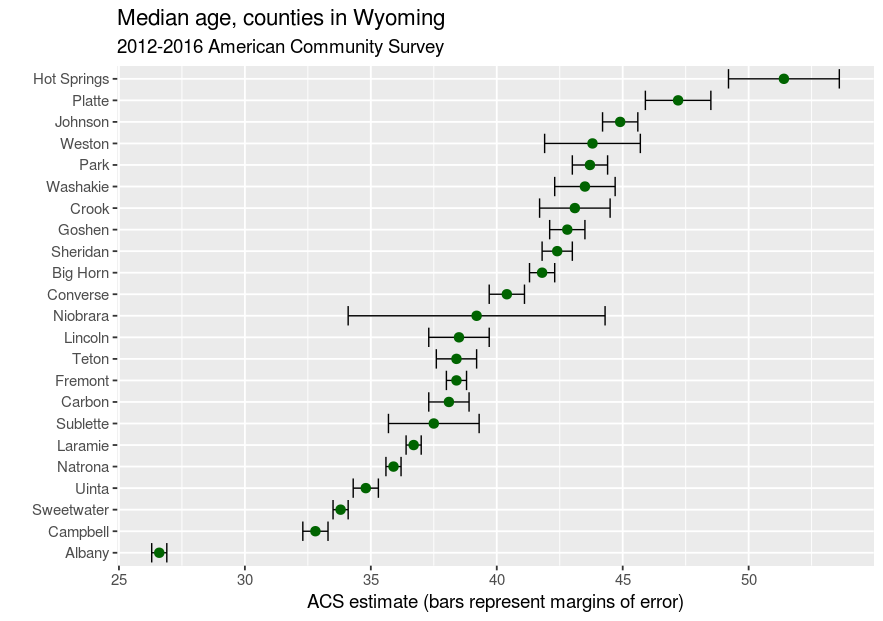
ggplot(wyoming_age2, aes(x = estimate, y = reorder(NAME, estimate))) + geom_errorbarh(aes(xmin = estimate - moe, xmax = estimate + moe)) + geom_point(size = 3, color = "darkgreen") + theme_grey(base_size = 14) + labs(title = "Tuổi trung vị, các quận ở Wyoming", subtitle = "American Community Survey 2012-2016", x = "Ước tính ACS (thanh biểu diễn sai số biên)", y = "")
Phân tích dữ liệu Điều tra Dân số Hoa Kỳ bằng R

biểu đồ sai số biên đã định dạng

Phân tích dữ liệu Điều tra Dân số Hoa Kỳ bằng R

Cùng luyện tập nào!

Phân tích dữ liệu Điều tra Dân số Hoa Kỳ bằng R

Preparing Video For Download...