Phân tích giỏ hàng trong R
Christopher Bruffaerts
Statistician
Phân tích giỏ hàng
Tập trung vào mua gì, không phải mua bao nhiêu;
tức là khách hàng có gì trong giỏ?
Chỉ số chính
Lưu ý
Tập luật trích xuất có thể rất lớn!
Không nên xem/hiển thị tất cả — luôn dùng một tập con hoặc các hàm head hay tail!
Quay lại cửa hàng tạp hóa

Bộ dữ liệu từ gói arules
# Loading the arules package
library(arules)
# Loading the Groceries dataset
data(Groceries)
summary(Groceries)
transactions as itemMatrix in sparse format with
9835 rows (elements/itemsets/transactions) and
169 columns (items) and a density of 0.02609146
most frequent items:
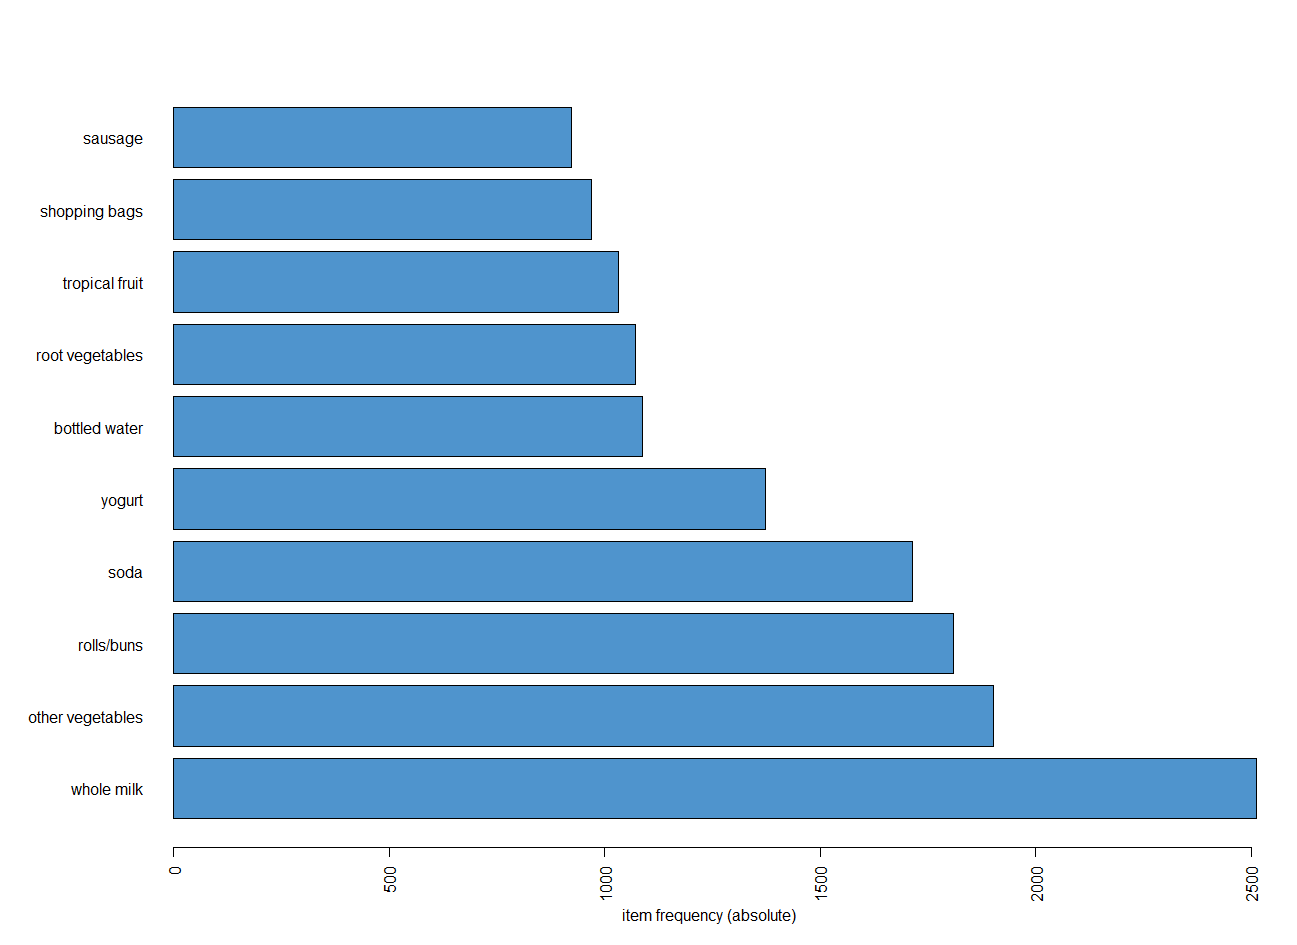
whole milk other vegetables rolls/buns soda yogurt
2513 1903 1809 1715 1372
(Other)
34055
element (itemset/transaction) length distribution:
sizes
1 2 3 4 5 6 7 8 9 10 11 12 13 14 15 16 17
2159 1643 1299 1005 855 645 545 438 350 246 182 117 78 77 55 46 29
18 19 20 21 22 23 24 26 27 28 29 32
14 14 9 11 4 6 1 1 1 1 3 1
Min. 1st Qu. Median Mean 3rd Qu. Max.
1.000 2.000 3.000 4.409 6.000 32.000
includes extended item information - examples:
labels level2 level1
1 frankfurter sausage meat and sausage
2 sausage sausage meat and sausage
3 liver loaf sausage meat and sausage
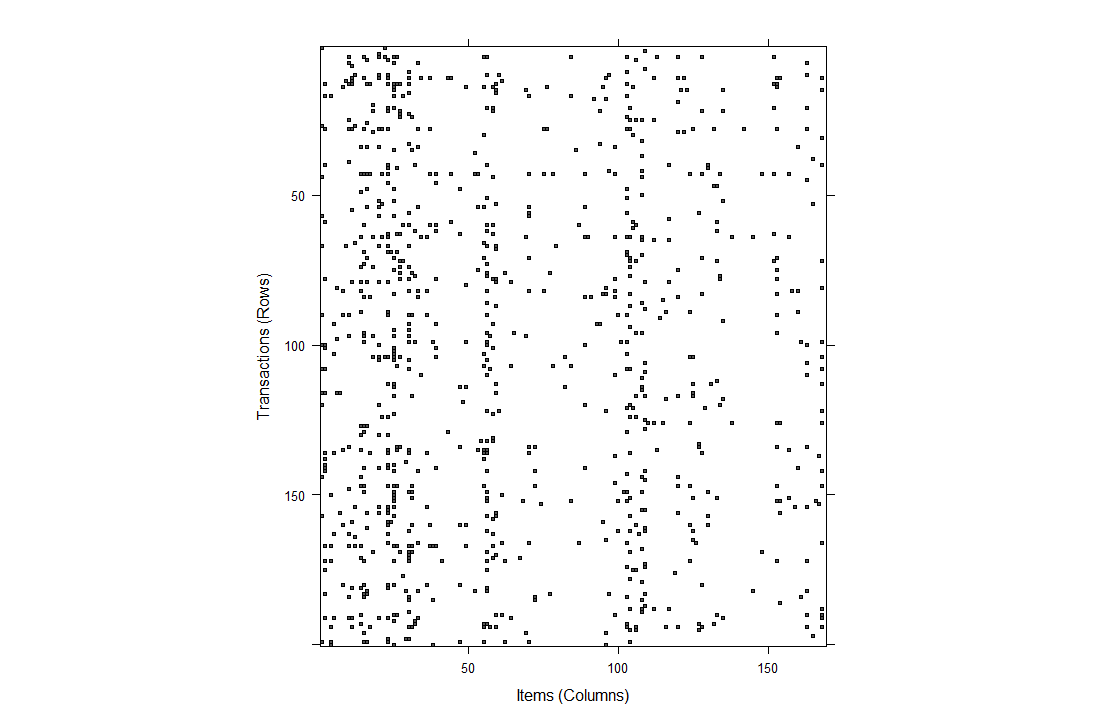
# Plotting a sample of 200 transactions
image(sample(Groceries, 200))
Mặt hàng phổ biến nhất
itemFrequencyPlot(Groceries,type="relative",
topN=10,horiz=TRUE,col='steelblue3')
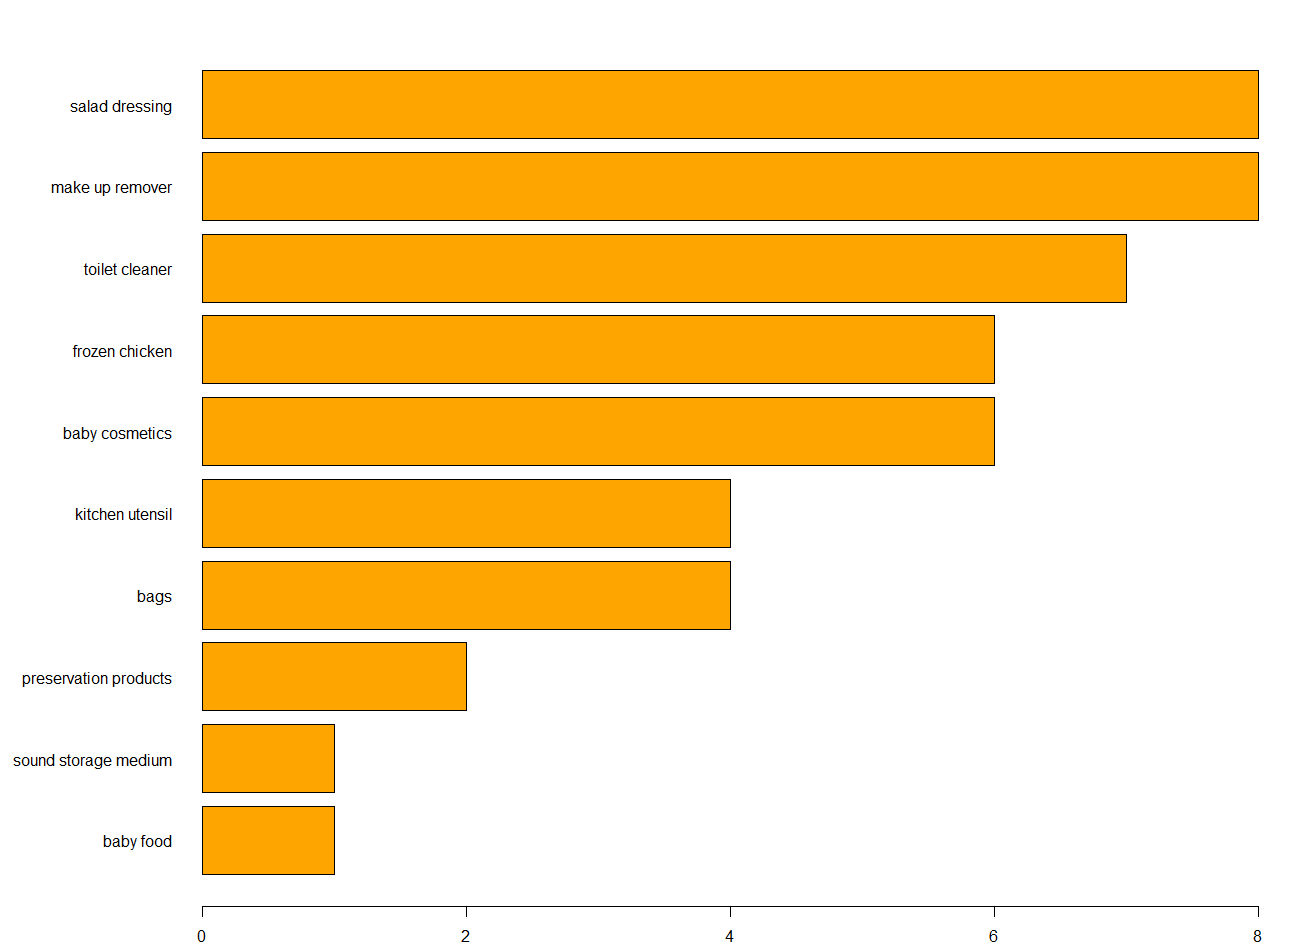
Mặt hàng ít phổ biến nhất
par(mar=c(2,10,2,2), mfrow=c(1,1))
barplot(sort(table(unlist(LIST(Groceries))))[1:10],
horiz = TRUE,las = 1,col='orange')
Bảng chéo (contingency)
# Contingency table
tbl = crossTable(Groceries)
tbl[1:4,1:4]
frankfurter sausage liver loaf ham
frankfurter 580 99 7 25
sausage 99 924 10 49
liver loaf 7 10 50 3
ham 25 49 3 256
Bảng chéo đã sắp xếp
# Sorted contingency table
tbl = crossTable(Groceries, sort = TRUE)
tbl[1:4,1:4]
whole milk other vegetables rolls/buns soda
whole milk 2513 736 557 394
other vegetables 736 1903 419 322
rolls/buns 557 419 1809 377
soda 394 322 377 1715
Bảng chéo (contingency)
# Counts
tbl['whole milk','flour']
[1] 83
# Kiểm định chi-bình phương
crossTable(Groceries, measure='chi')['whole milk', 'flour']
[1] 0.003595389
Bảng chéo với chỉ số khác
crossTable(Groceries, measure='lift',sort=T)[1:4,1:4]
whole milk other vegetables rolls/buns soda
whole milk NA 1.5136341 1.205032 1.571735
other vegetables 1.5136341 NA 1.197047 0.9703476
rolls/buns 1.2050318 1.1970465 NA 1.1951242
soda 0.8991124 0.9703476 1.195124 NA
MovieLens: Hệ thống gợi ý trên web đề xuất phim để người dùng xem.

Phân tích giỏ hàng trong R