Thành phần chính trong phân tích hồi quy
Machine Learning cho Phân tích Marketing bằng R

Verena Pflieger
Data Scientist at INWT Statistics
PC trong phân tích hồi quy I
mod1 <- lm(customerSatis ~ ., dataCustomers)library(car) vif(mod1)
      nOrders       nItemsOrdered          nItemsSold        salesOrdered
    29.482287           24.437448           10.390998            5.134720
    salesSold         returnRatio       shareOwnBrand           shareSale
     9.685617           23.778800            1.571607            1.178773
 shareVoucher          crDuration monetaryReturnRatio  meanDaysBetwOrders
     1.213011            1.757509           10.632243            1.698369
salesPerOrder        salesPerItem       itemsPerOrder   itemsSoldPerOrder
     6.563474            4.557981            4.821610           15.949072
# Create dataframe with customer satisfaction and first 6 components
dataCustComponents <- cbind(dataCustomers[, "customerSatis"],
                            pcaCust$x[,1:6]) %>%
  as.data.frame
mod2 <- lm(customerSatis ~ ., dataCustComponents)
vif(mod2)
PC1 PC2 PC3 PC4 PC5 PC6
  1   1   1   1   1   1
summary(mod1)$adj.r.squared
0.8678583
summary(mod2)$adj.r.squared
0.7123822
summary(mod2)
Call:
lm(formula = customerSatis ~ ., data = dataCustComponents)
Residuals:
    Min      1Q  Median      3Q     Max
-3.9279 -0.2411  0.0179  0.2865  1.4972
Coefficients:
             Estimate Std. Error t value Pr(>|t|)
(Intercept)  2.985945   0.014039 212.682  < 2e-16 ***
PC1         -0.175434   0.006704 -26.167  < 2e-16 ***
PC2          0.296659   0.007643  38.815  < 2e-16 ***
PC3         -0.012816   0.010838  -1.182    0.237
PC4         -0.116651   0.011665 -10.000  < 2e-16 ***
PC5          0.101963   0.012508   8.152 1.09e-15 ***
PC6          0.126677   0.013072   9.691  < 2e-16 ***
- - -
Signif. codes:  0 '***' 0.001 '**' 0.01 '*' 0.05 '.' 0.1 ' ' 1
Residual standard error: 0.4415 on 982 degrees of freedom
Multiple R-squared:  0.7141,    Adjusted R-squared:  0.7124
F-statistic: 408.9 on 6 and 982 DF,  p-value: < 2.2e-16
| Bài học về PCA | |
|---|---|
| Bạn đã học... | cách giảm số biến mà không mất quá nhiều thông tin |
| rằng các biến nên được chuẩn hóa trước khi chạy PCA | |
| cách quyết định số thành phần quan trọng | |
| cách diễn giải các thành phần đã chọn |
| Bài học từ mô hình | |
|---|---|
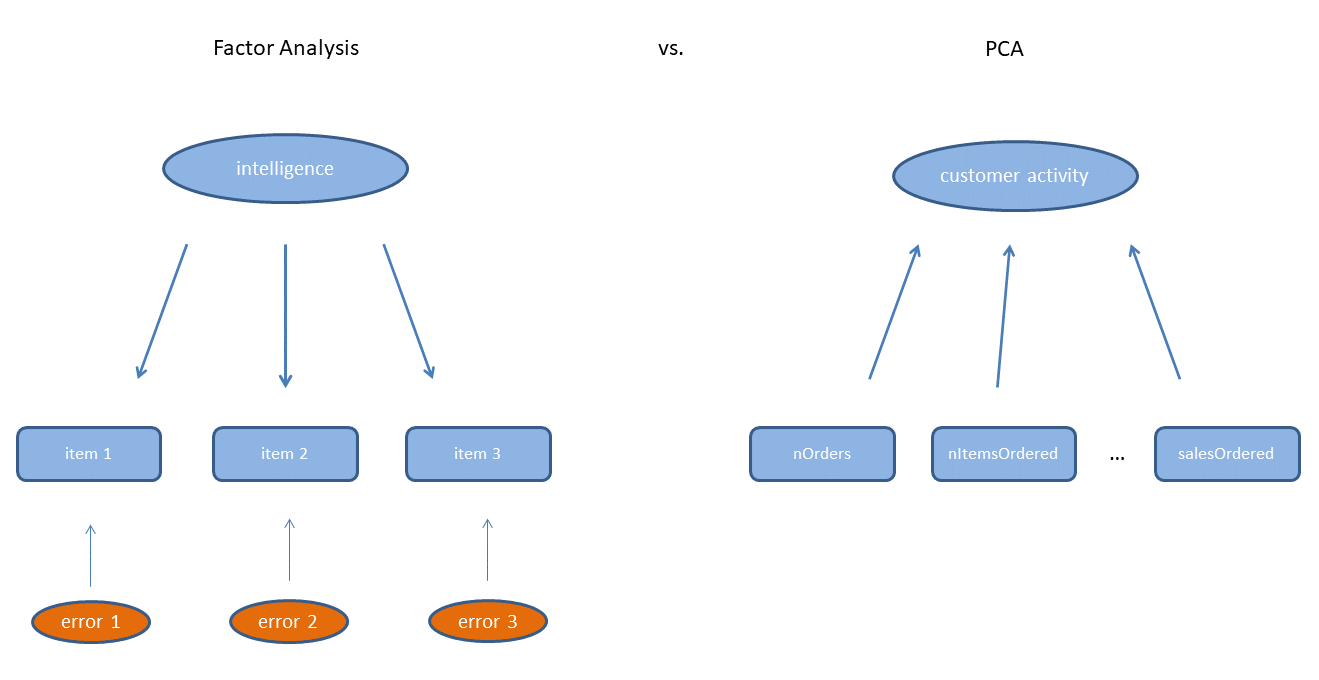
| Bạn đã học... | rằng các biến gốc có thể rút gọn còn 6 thành phần, như mức độ hoạt động, hành vi trả hàng và nhận diện thương hiệu của khách hàng |
| rằng dùng 6 thành phần đầu để giải thích mức độ hài lòng làm giảm phương sai giải thích, nhưng giải quyết được vấn đề đa cộng tuyến |
Cùng luyện tập nào!
Machine Learning cho Phân tích Marketing bằng R

