Tìm hiểu kỹ hơn về các đỉnh
ChIP-seq với Bioconductor trong R

Peter Humburg
Statistician, Macquarie University
Sử dụng Gviz
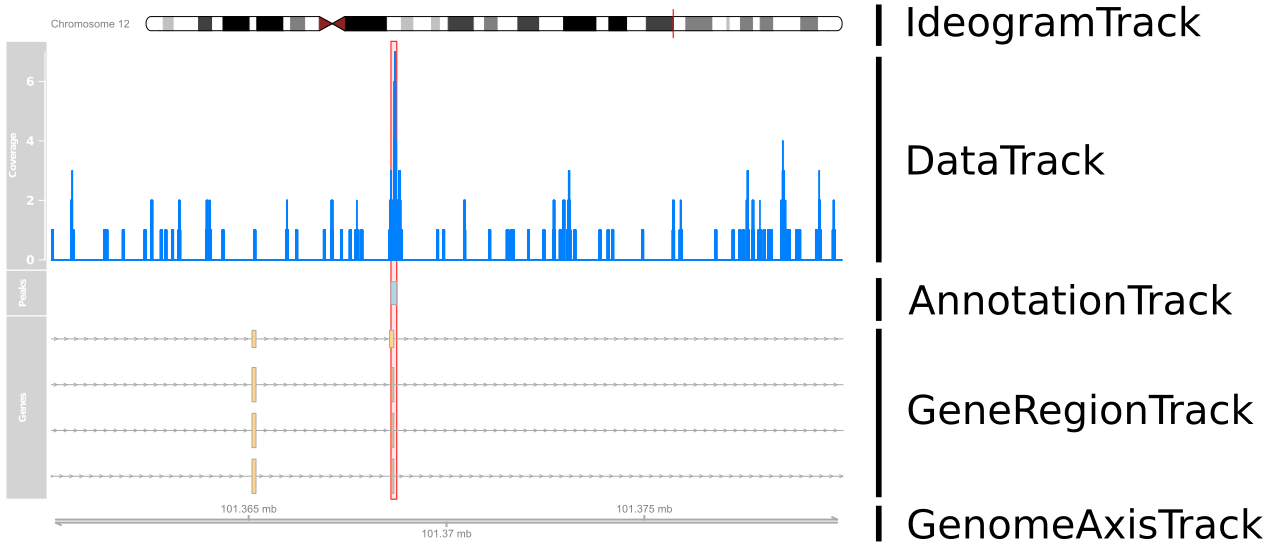
Chúng ta đang vẽ gì?
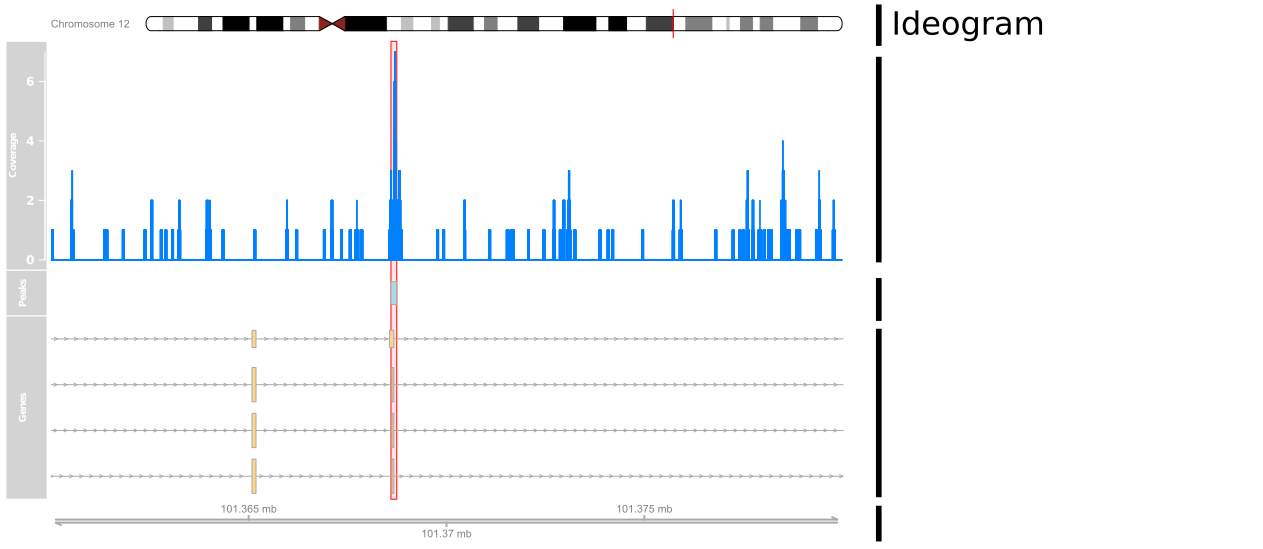
Chúng ta đang vẽ gì?
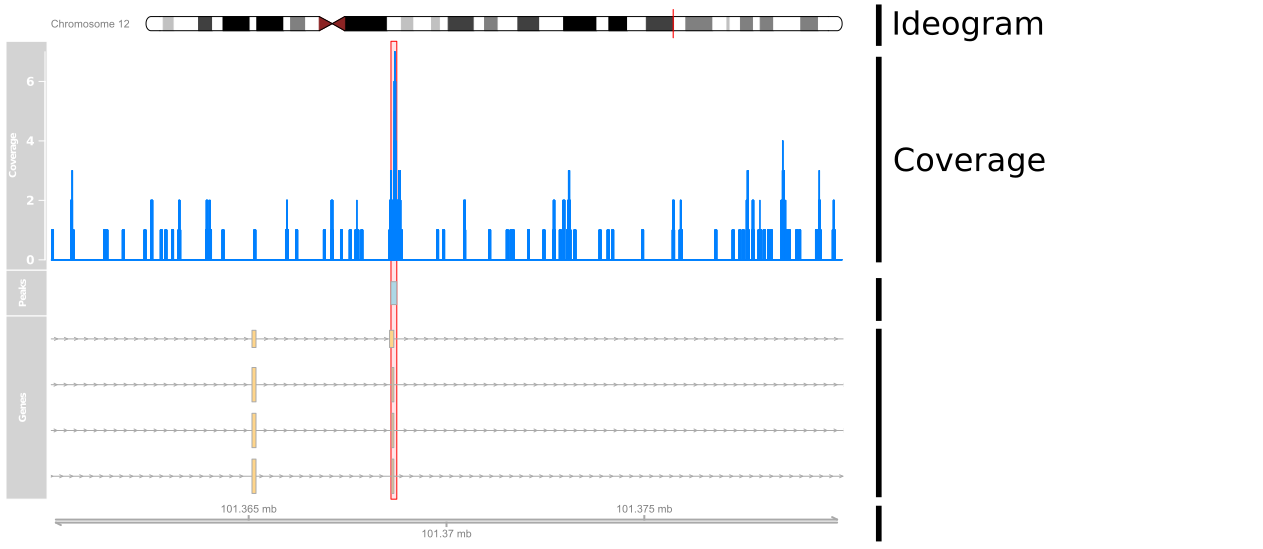
Chúng ta đang vẽ gì?
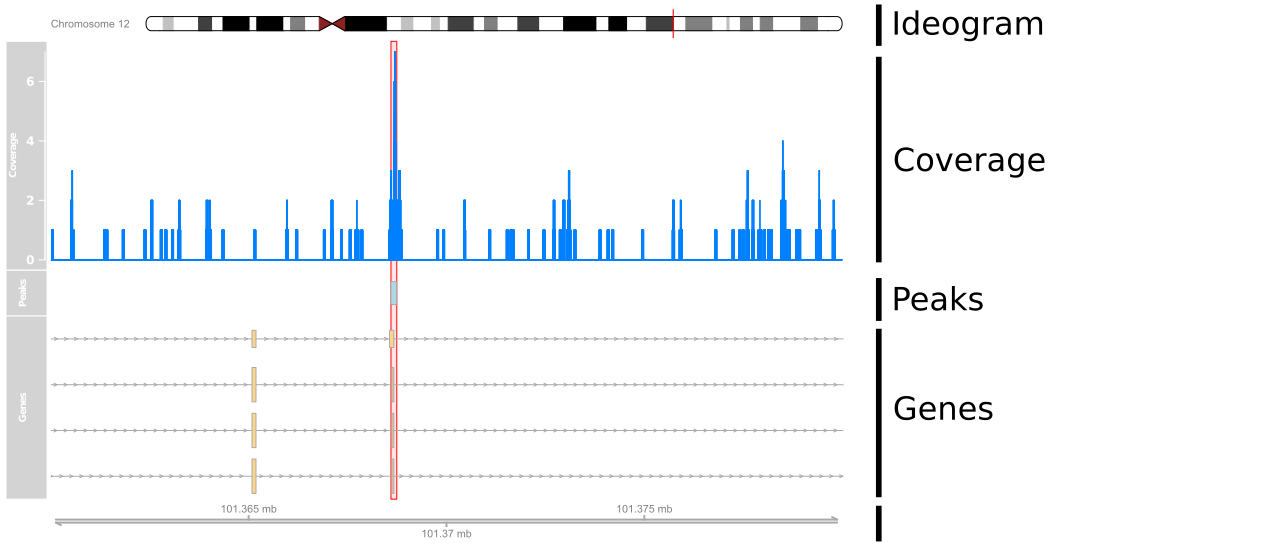
Chúng ta đang vẽ gì?
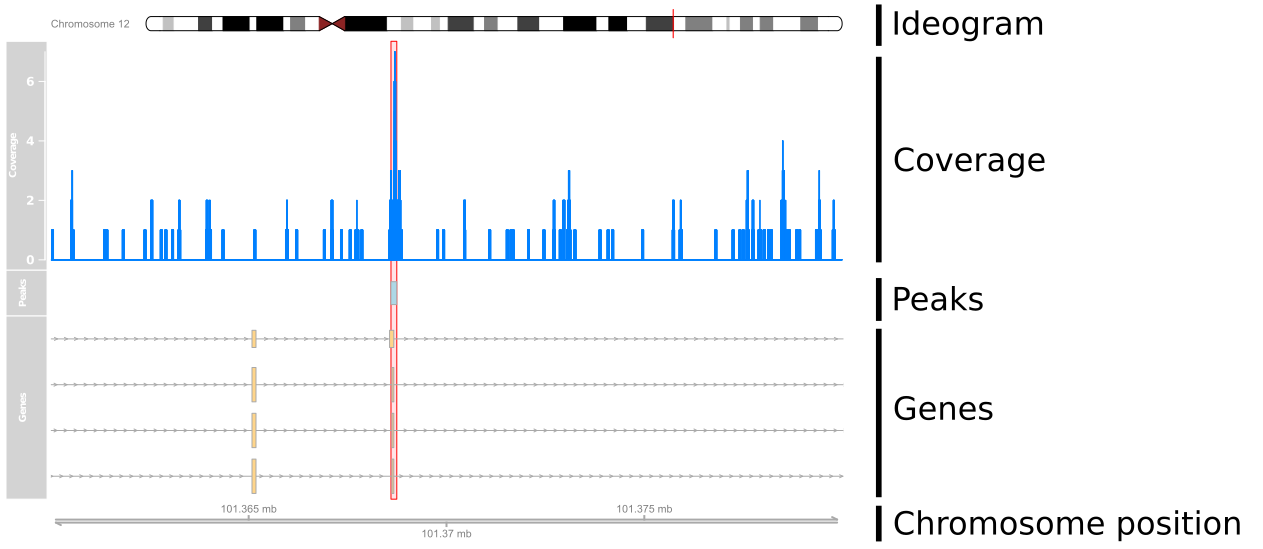
Thiết lập tọa độ
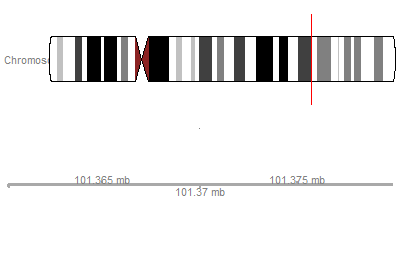
Thêm dữ liệu
cover_track <- DataTrack(cover_ranges,window=100000,type='h',name="Coverage")
plotTracks(list(ideogram, cover_track, axis), from=101360000, to=101380000)
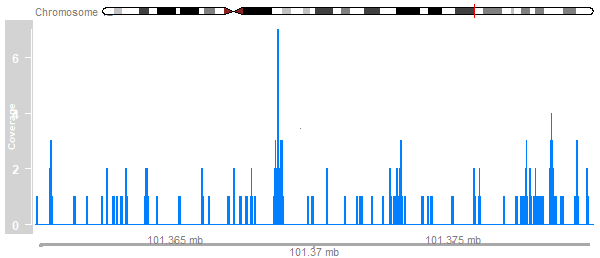
Thêm chú giải
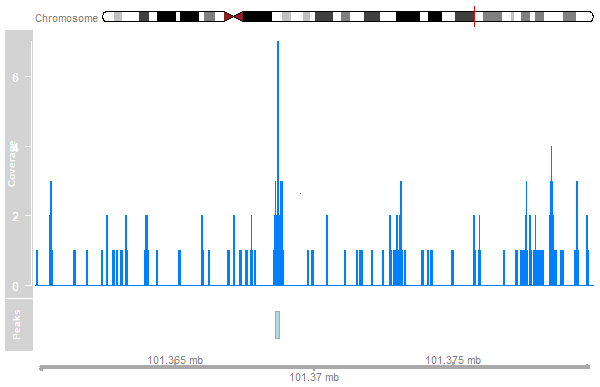
peak_track <- AnnotationTrack(peaks, name="Peaks")
plotTracks(list(ideogram, cover_track, peak_track, axis),
           from=101360000, to=101380000)
Chú giải gene
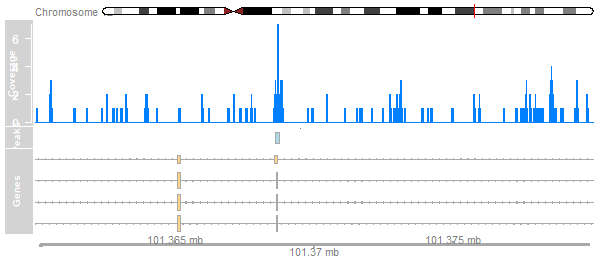
library(TxDb.Hsapiens.UCSC.hg19.knownGene)tx <- GeneRegionTrack(TxDb.Hsapiens.UCSC.hg19.knownGene, chromosome="chr12", start=101360000, end=101380000, name="Genes") plotTracks(list(ideogram, cover_track, peak_track, tx, axis), from=101360000, to=101380000)