Additional TrelliscopeJS features

Trực quan hóa Dữ liệu Lớn với Trelliscope trong R

Ryan Hafen

Author, TrelliscopeJS

ggplot panel interactivity using Plotly
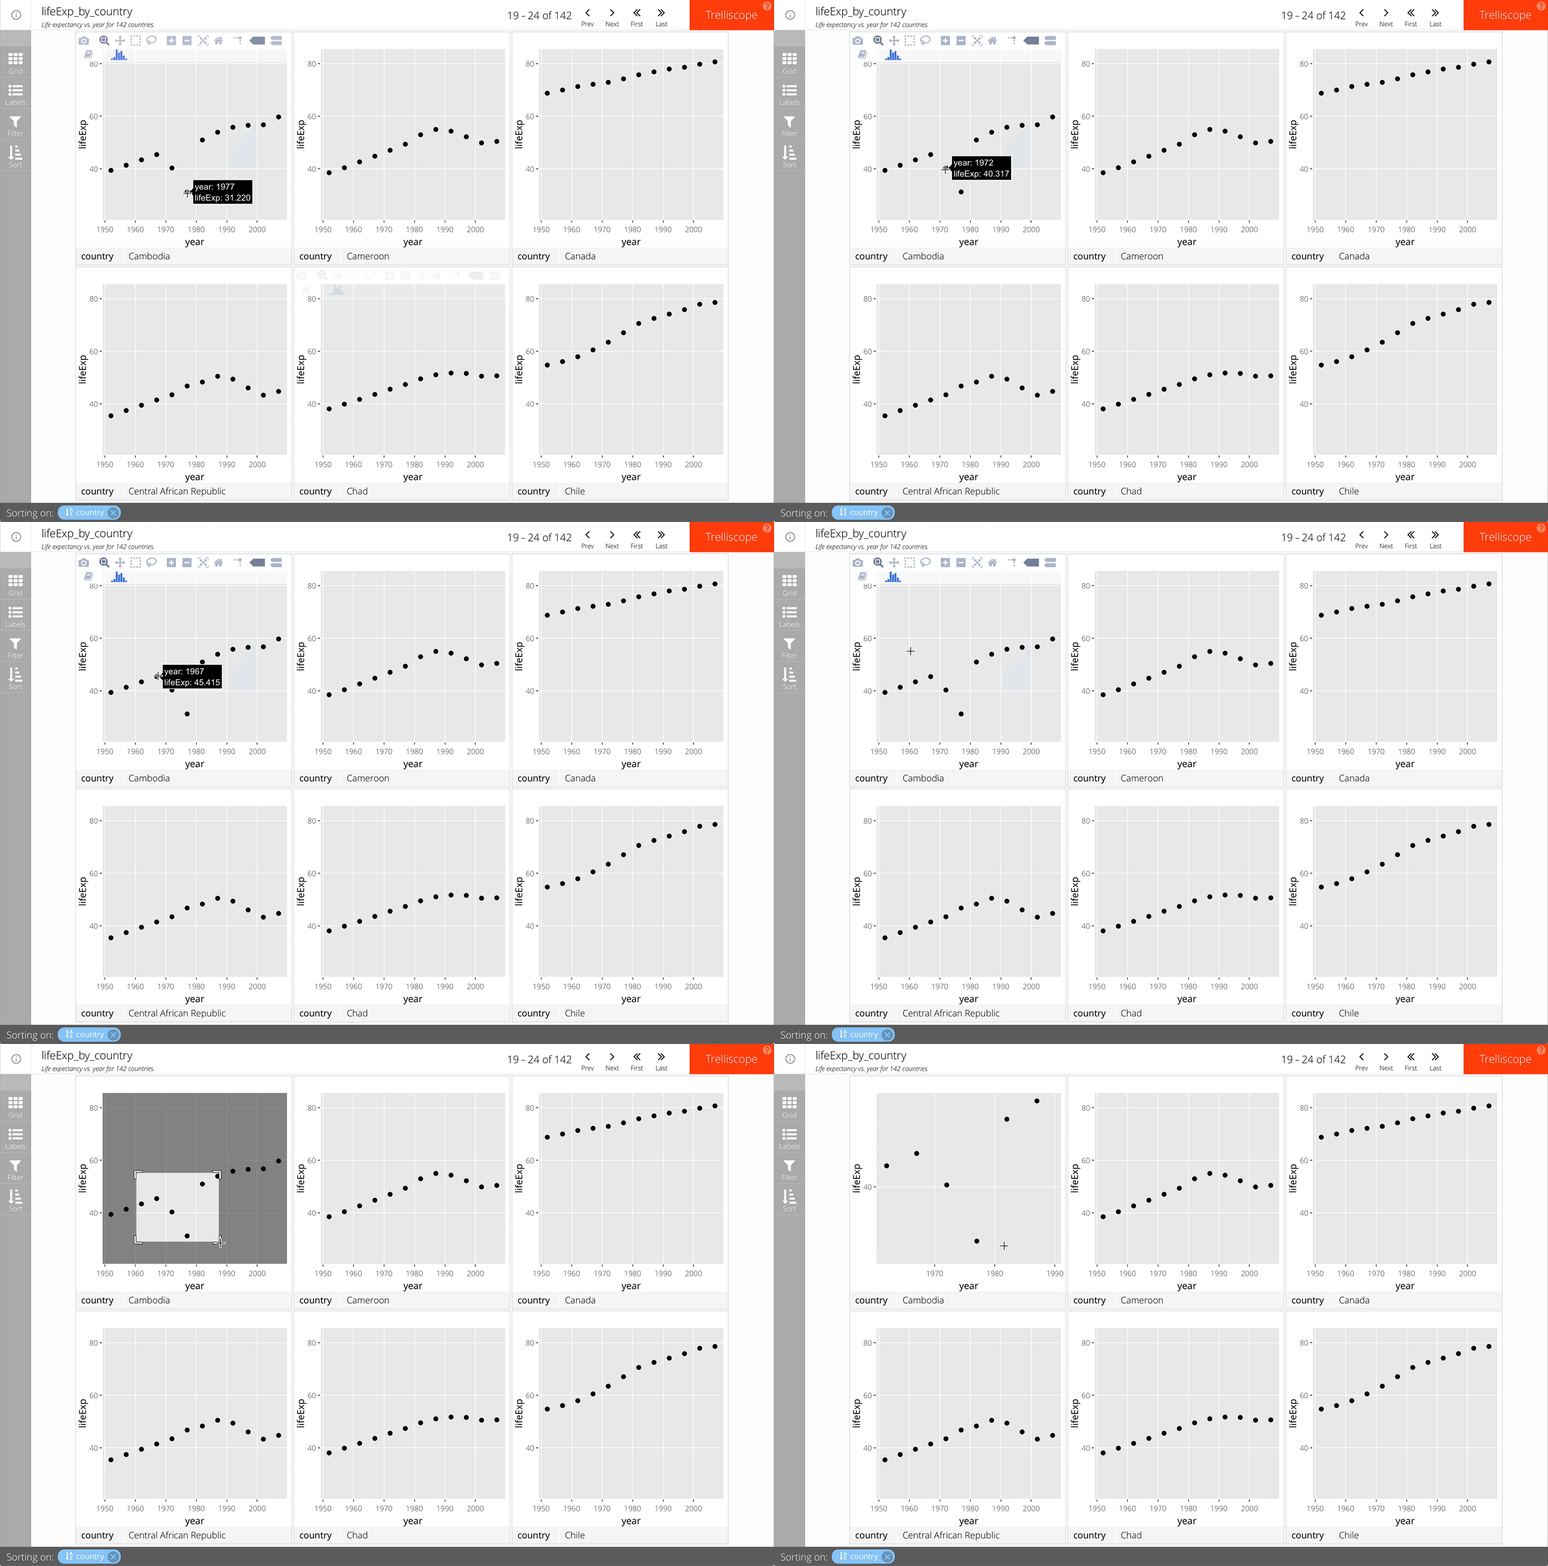
Simply add as_plotly = TRUE to facet_trelliscope().

For example:

gap_life <- select(gapminder, year, lifeExp, country, continent)
ggplot(gap_life, aes(year, lifeExp)) +
  geom_point() +
  facet_trelliscope(~ country + continent,
    name = "lifeExp_by_country",
    desc = "Life expectancy vs. year for 142 countries.",
    nrow = 2, ncol = 3,
    as_plotly = TRUE)
Trực quan hóa Dữ liệu Lớn với Trelliscope trong R

ggplot panel interactivity using Plotly

Trực quan hóa Dữ liệu Lớn với Trelliscope trong R

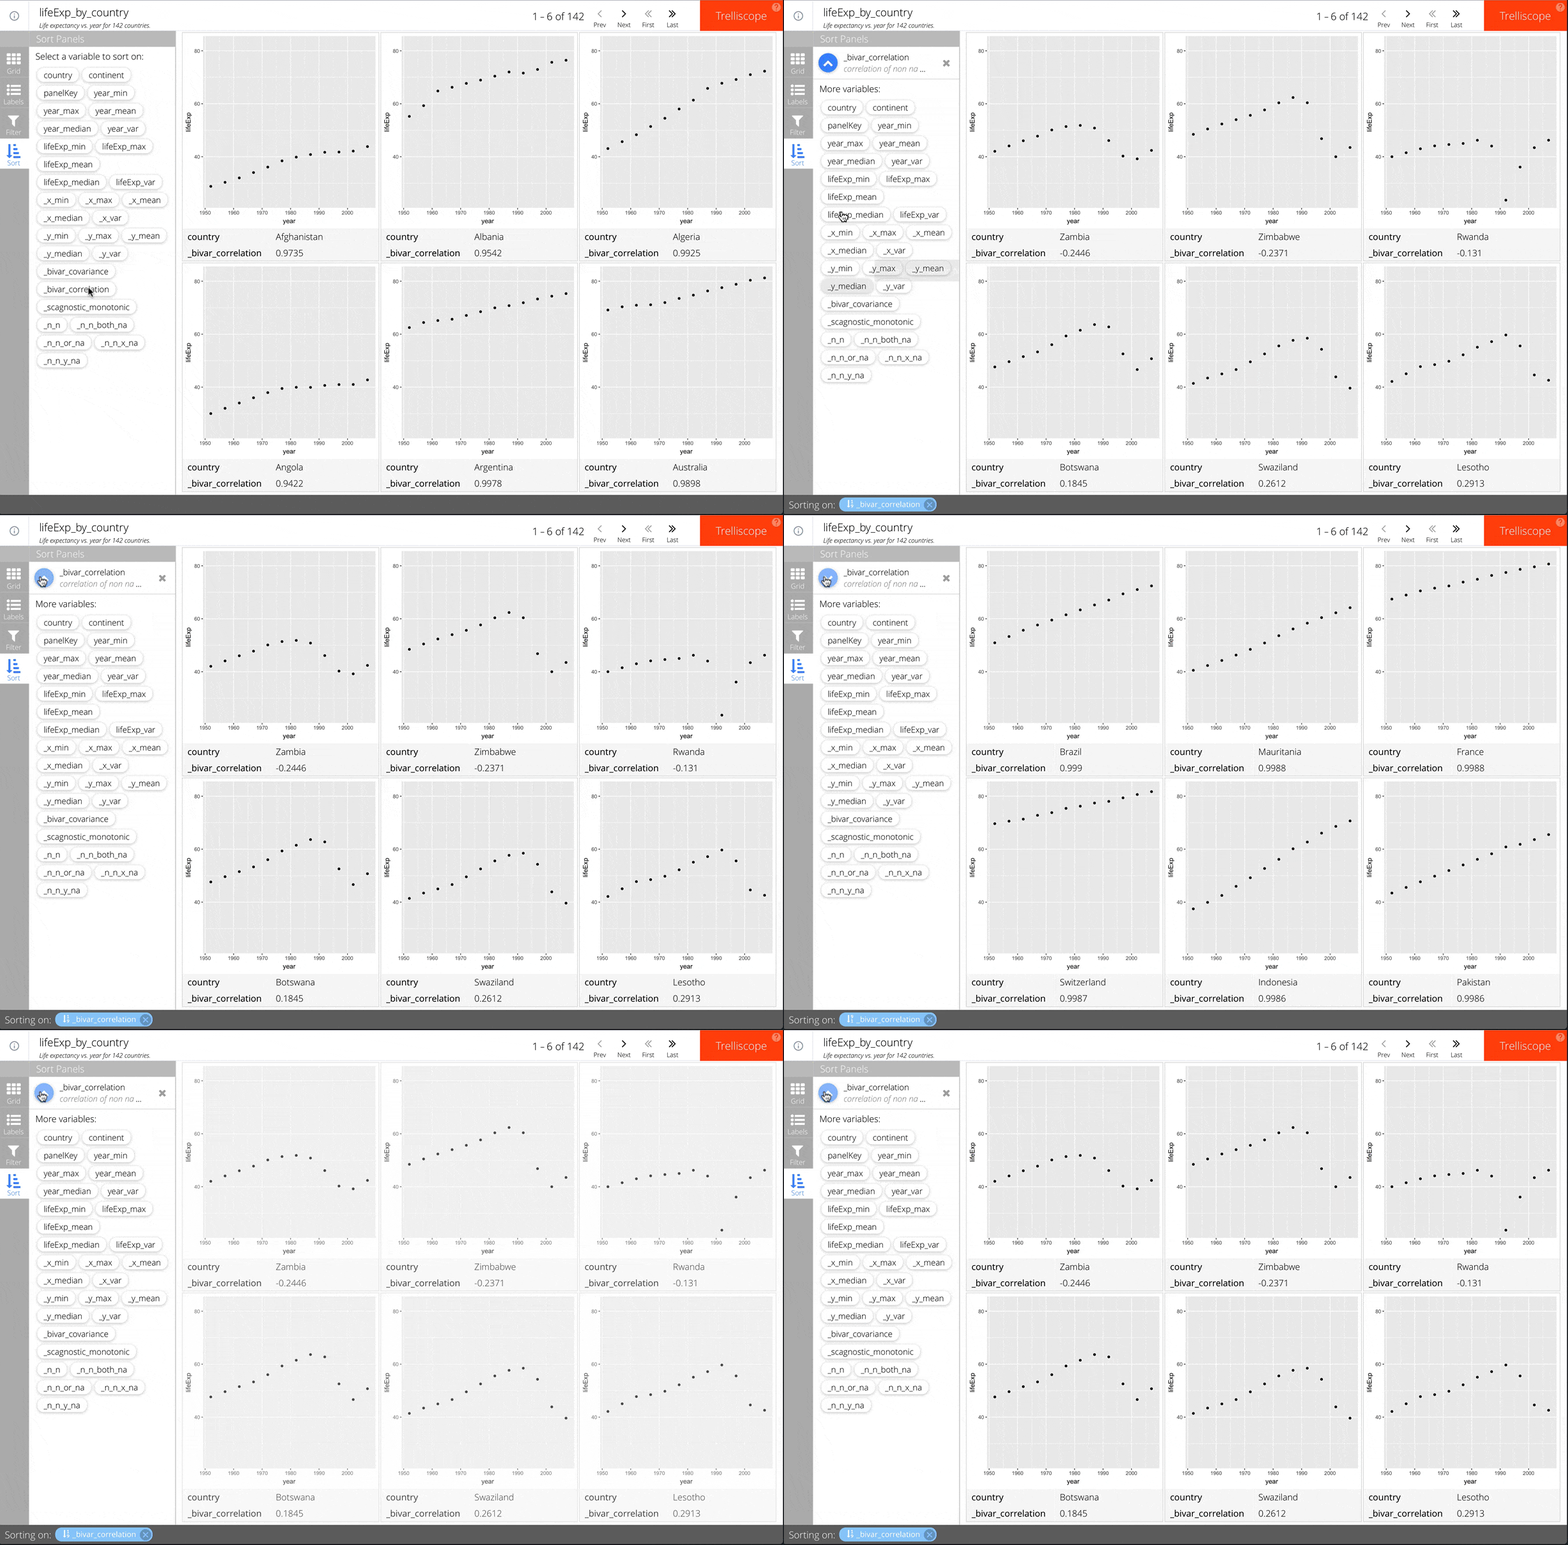
Context-based automatic cognostics

Simply add auto_cog = TRUE to facet_trelliscope().

For example:

ggplot(gap_life, aes(year, lifeExp)) +
  geom_point() +
  facet_trelliscope(~ country + continent,
    name = "lifeExp_by_country",
    desc = "Life expectancy vs. year for 142 countries.",
    nrow = 2, ncol = 3,
    auto_cog = TRUE)

See the help for autocogs::autocog for more information about available automatic cognostics.

Trực quan hóa Dữ liệu Lớn với Trelliscope trong R

Context-based automatic cognostics

Trực quan hóa Dữ liệu Lớn với Trelliscope trong R

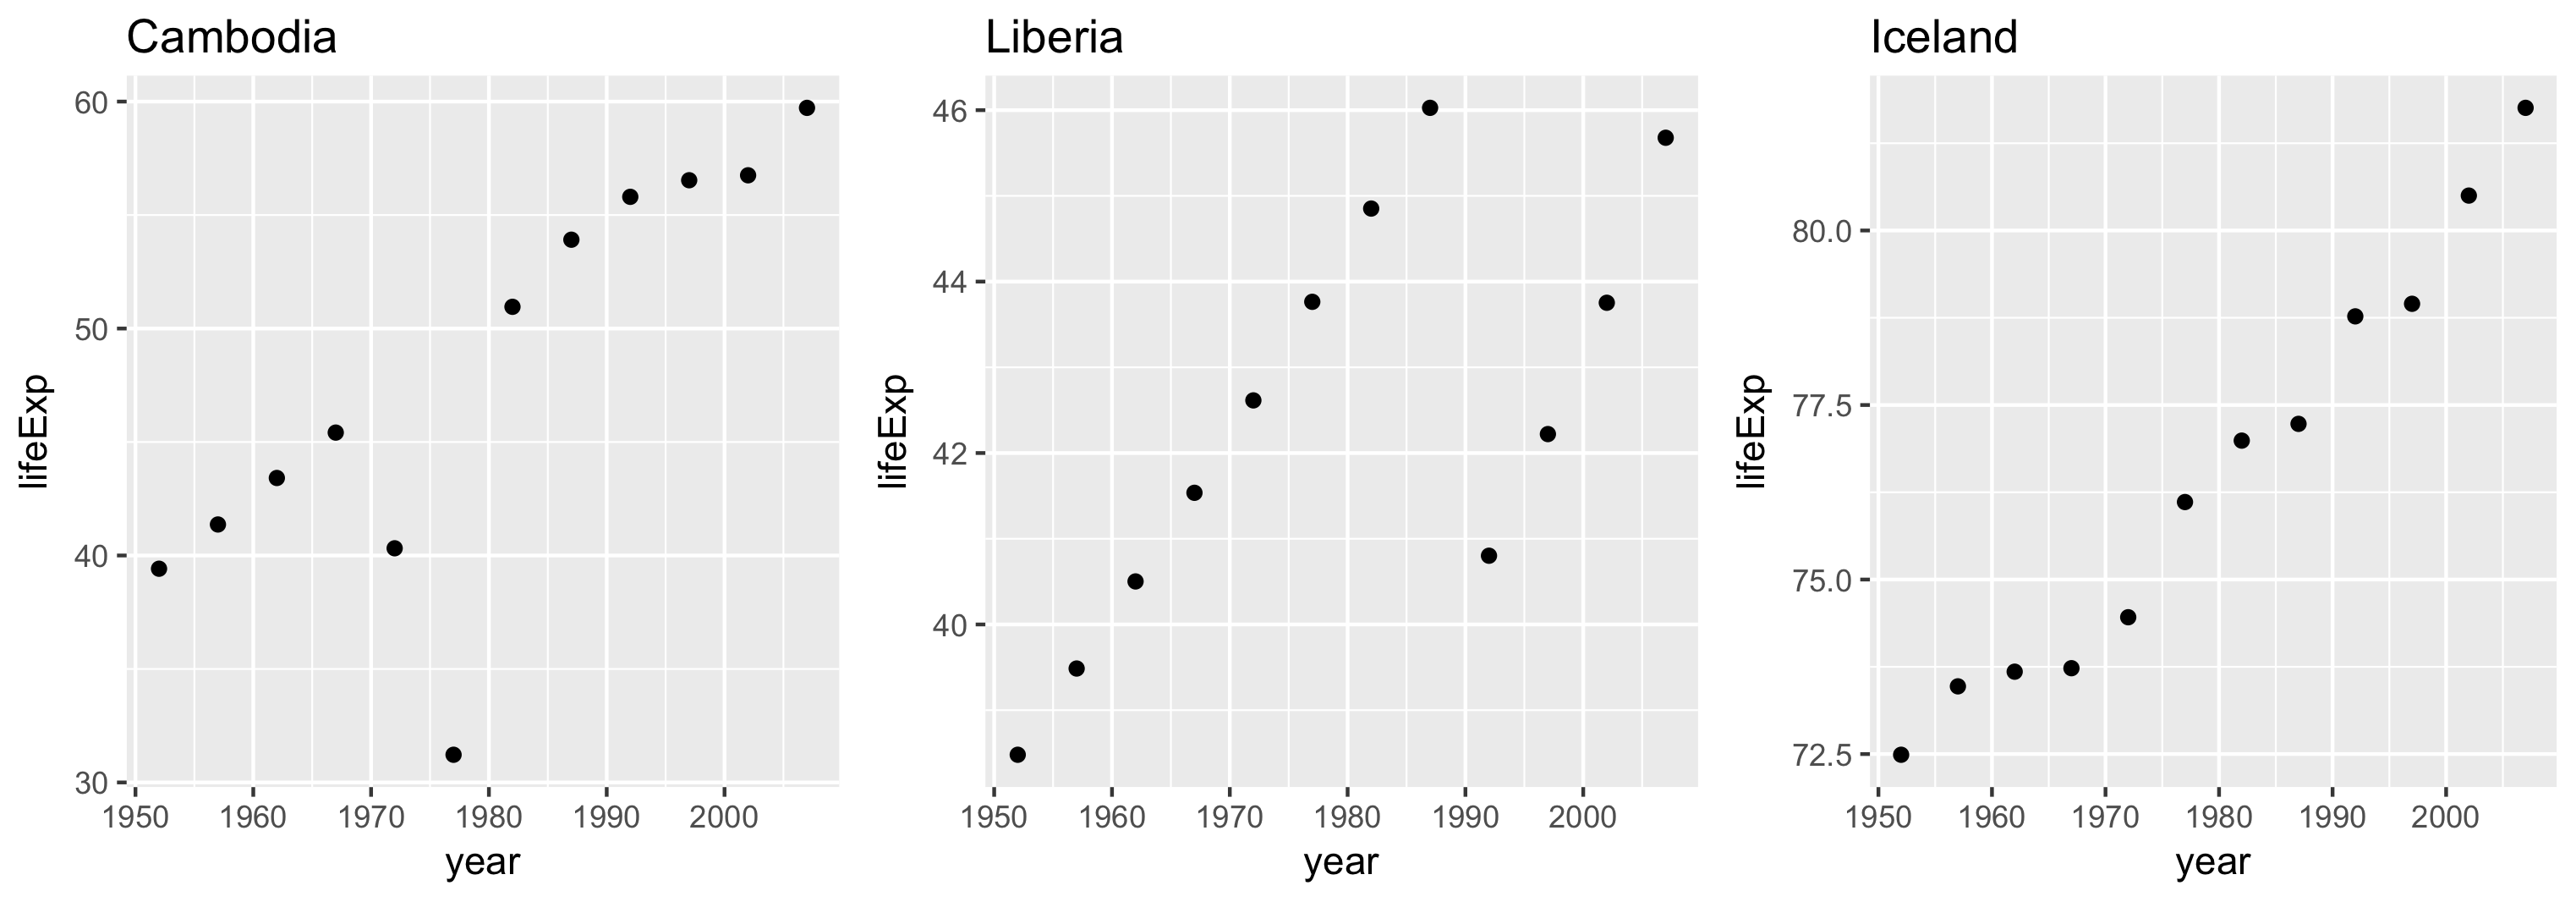
Axis limits

Axis limit ranges can be controlled with the scales argument.

Three options:

  • "same" (default)
  • "sliced"
  • "free"
Trực quan hóa Dữ liệu Lớn với Trelliscope trong R

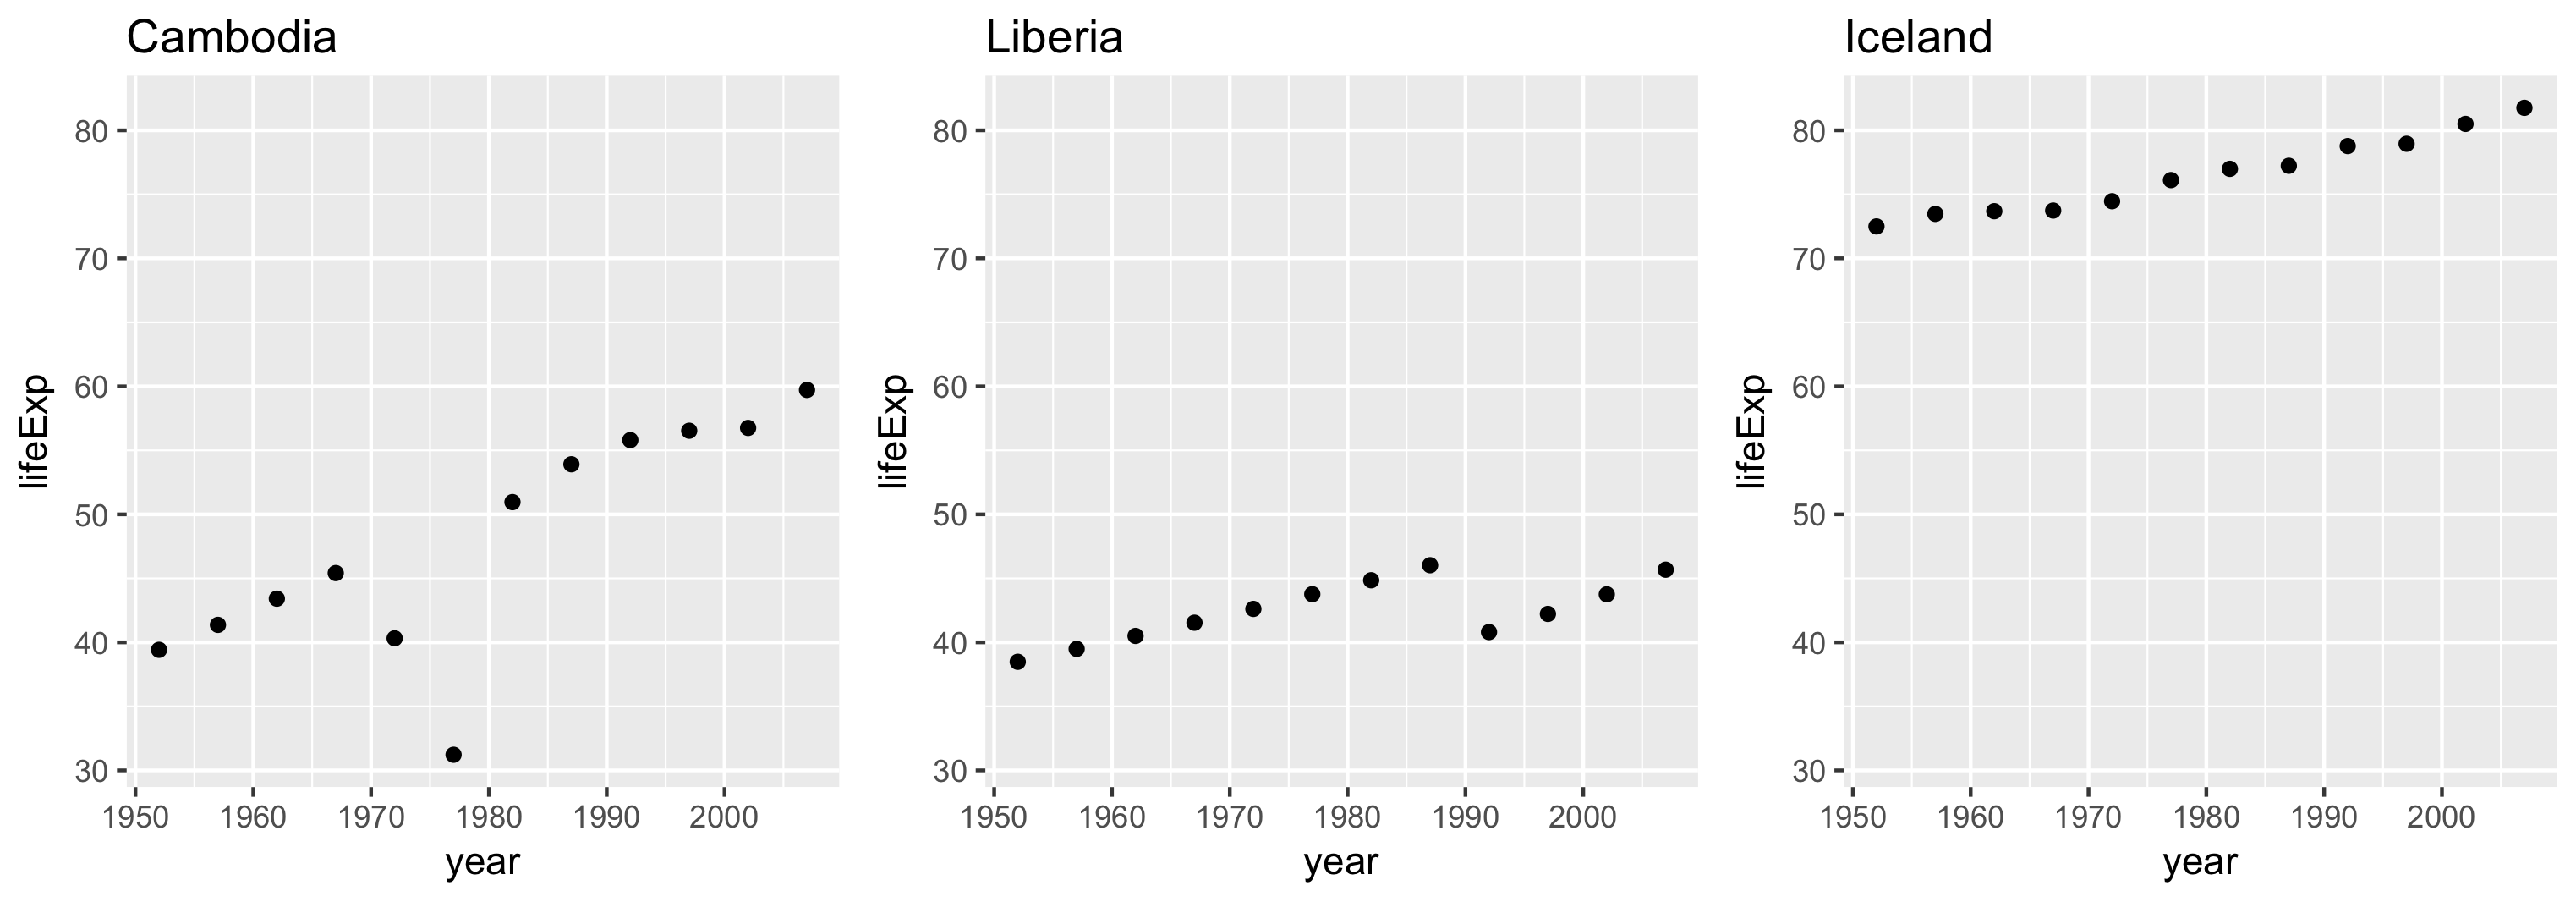
scales = "same"

Each panel's limits are the same.

Enables "apples to apples" comparisons across panels.
Trực quan hóa Dữ liệu Lớn với Trelliscope trong R

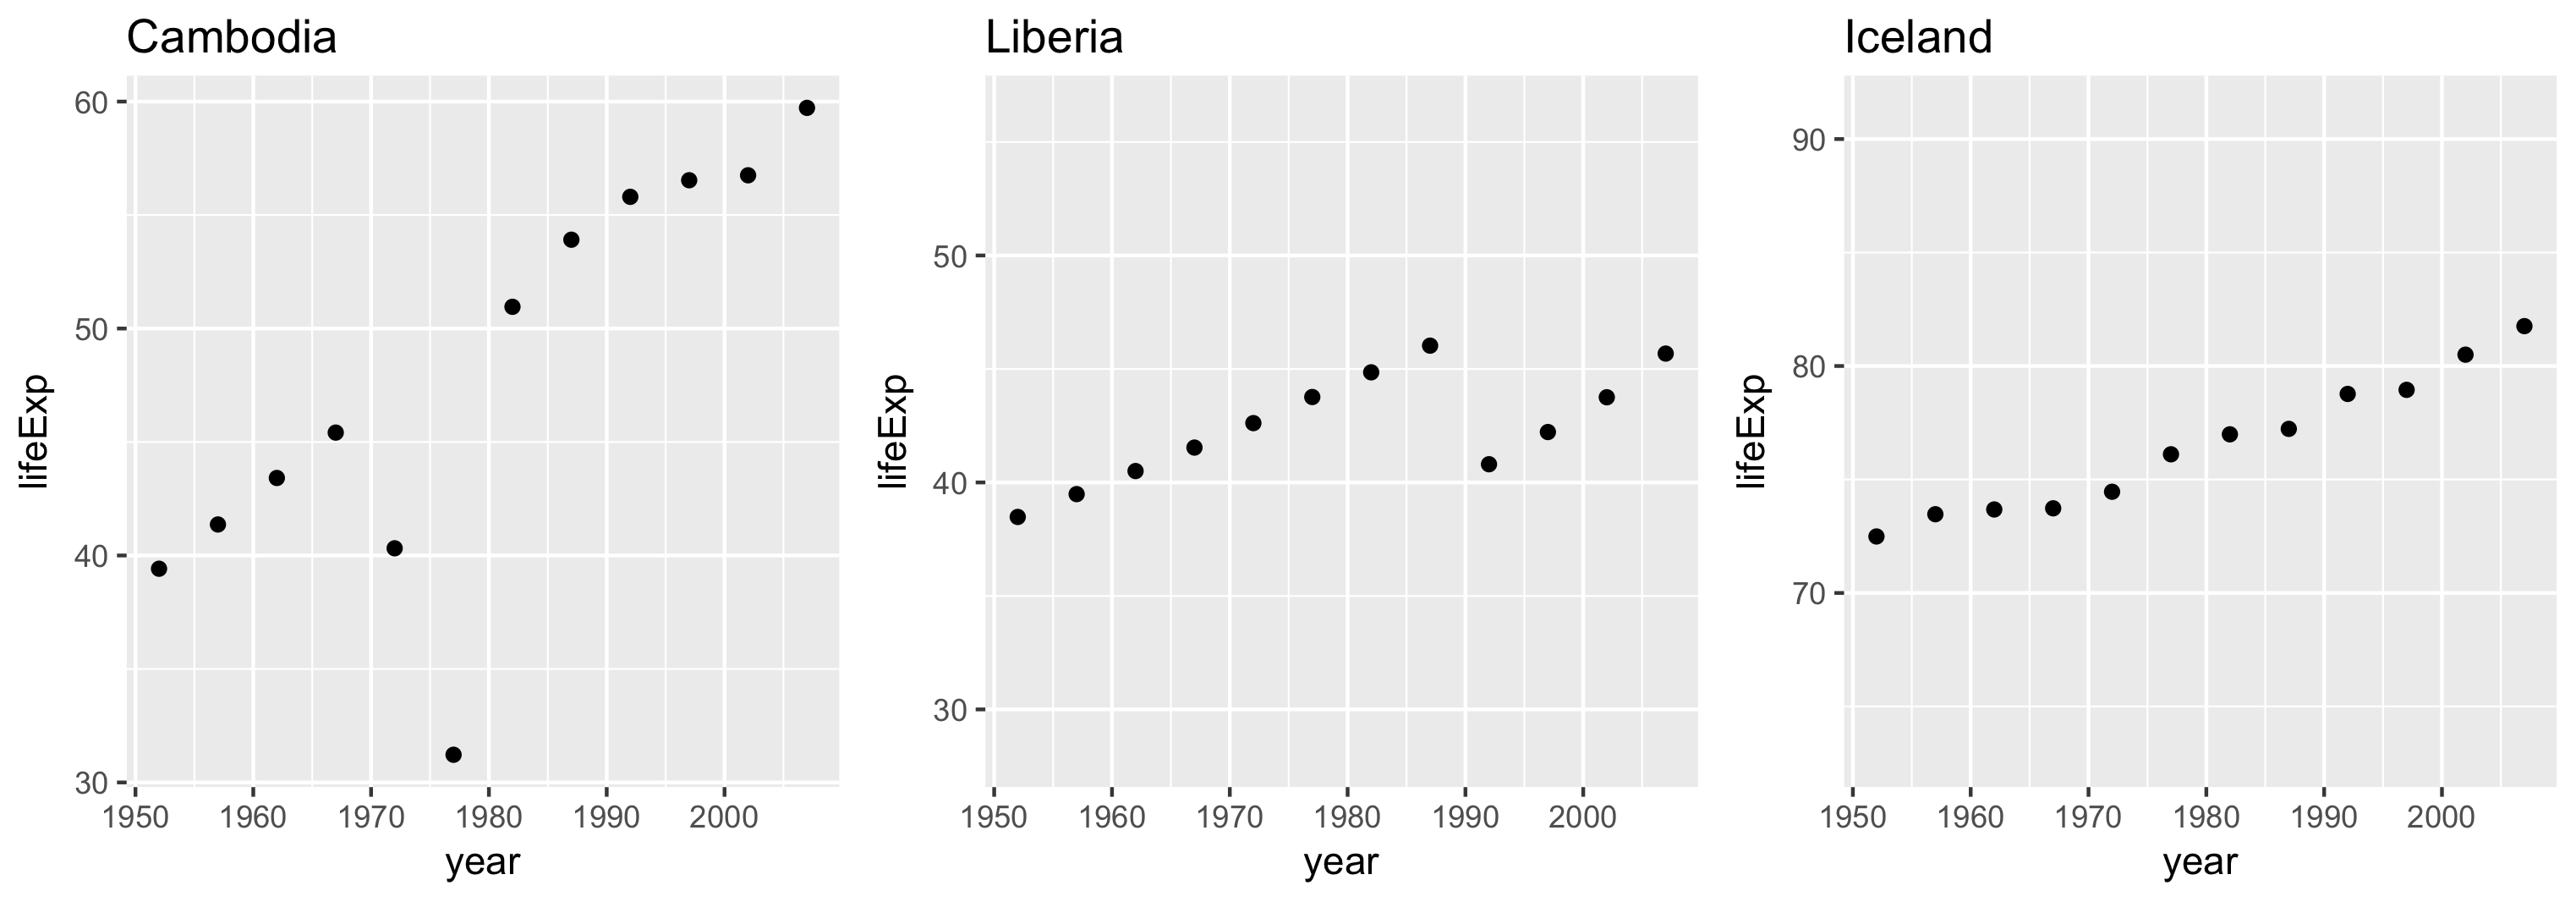
scales = "sliced"

Each panel's limits span the same range but don't necessarily start in the same place.

Useful for making comparisons of differences of scale.
Trực quan hóa Dữ liệu Lớn với Trelliscope trong R

scales = "free"

Each panel's limits are based on the bounds of its own data.
Trực quan hóa Dữ liệu Lớn với Trelliscope trong R

Let's practice!

Trực quan hóa Dữ liệu Lớn với Trelliscope trong R

Preparing Video For Download...