Biểu đồ con

Trực quan hóa dữ liệu tương tác với Bokeh

George Boorman

Core Curriculum Manager, DataCamp

Vì sao dùng biểu đồ con?
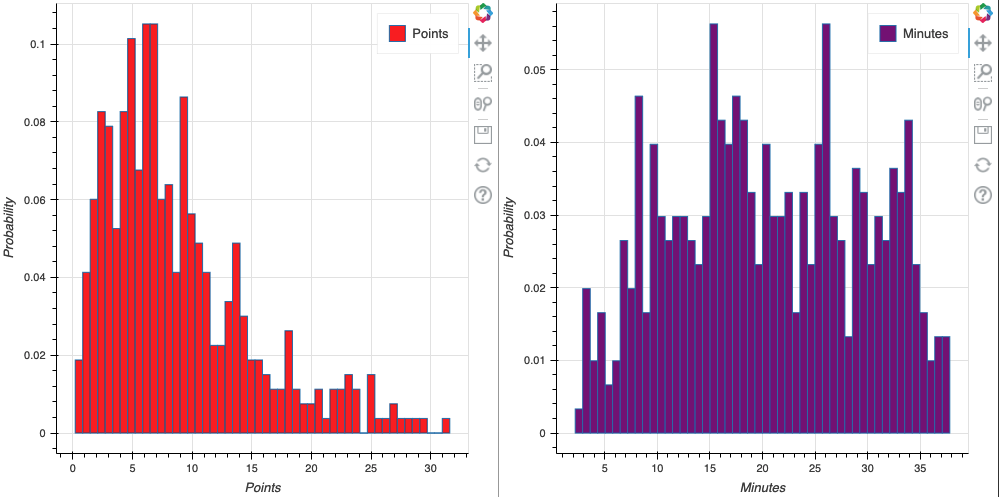
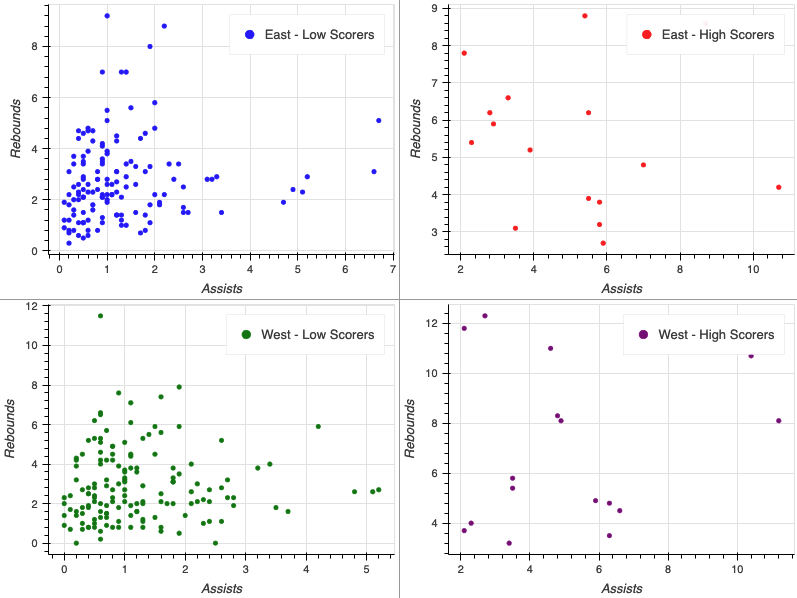
biểu đồ tần suất

hàng phụ cao vs thấp

Trực quan hóa dữ liệu tương tác với Bokeh

Tạo hàng (row)

from bokeh.layouts import row

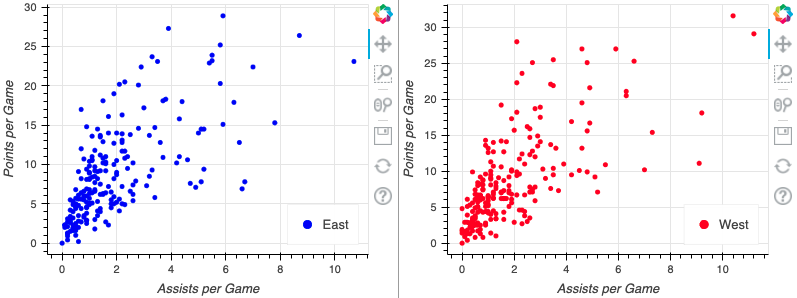
east_source = ColumnDataSource(data=east) west_source = ColumnDataSource(data=west) fig_one = figure(x_axis_label="Assists per Game", y_axis_label="Points per Game") fig_two = figure(x_axis_label="Assists per Game", y_axis_label="Points per Game")
fig_one.circle(x="assists", y="points", source=east_source, color="blue", legend_label="East") fig_two.circle(x="assists", y="points", source=west_source, color="blue", legend_label="West")
output_file(filename="row_plots.html")
show(row(fig_one, fig_two))
Trực quan hóa dữ liệu tương tác với Bokeh

Biểu đồ con theo hàng

biểu đồ hàng nba

Trực quan hóa dữ liệu tương tác với Bokeh

Biểu đồ con theo cột

from bokeh.layouts import column

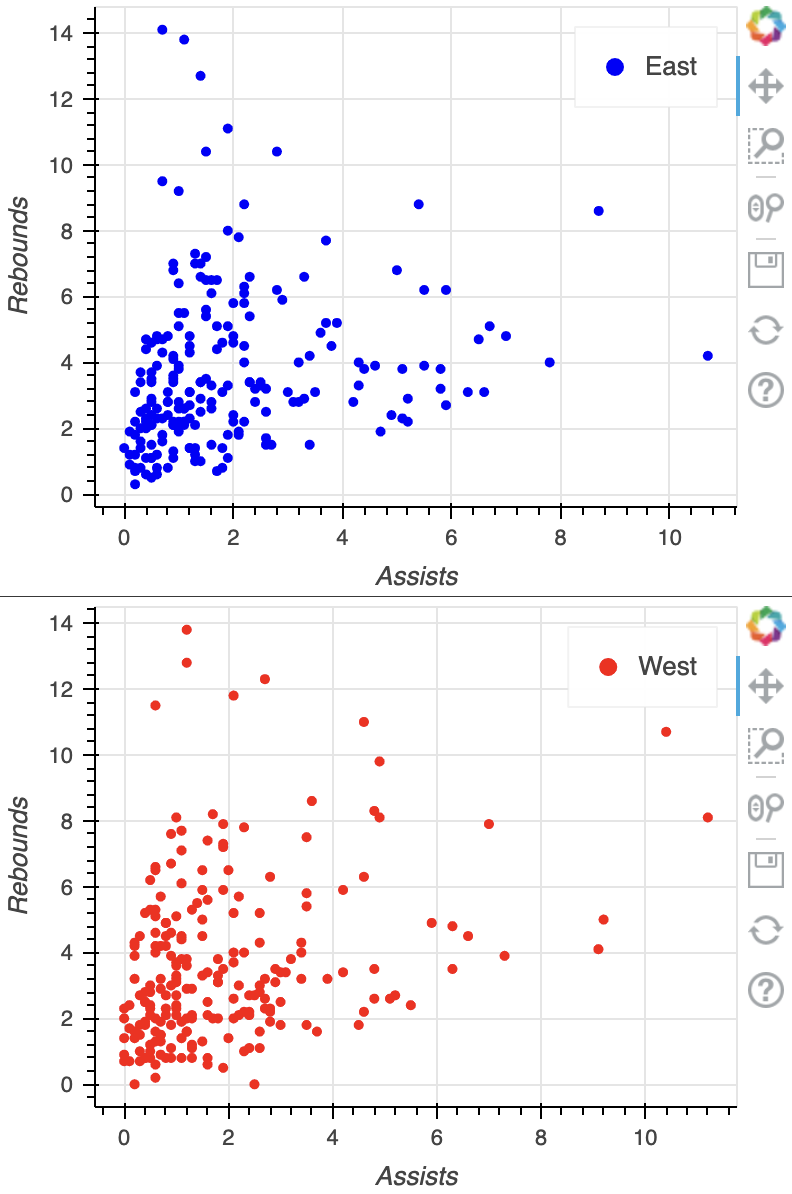
fig_one = figure(x_axis_label="Assists", y_axis_label="Rebounds") fig_two = figure(x_axis_label="Assists", y_axis_label="Rebounds") fig_one.circle(x="assists", y="rebounds", source=east_source, color="blue", legend_label="East") fig_two.circle(x="assists", y="rebounds", source=east_source, color="blue", legend_label="East")
output_file(filename="column_plots.html") show(column(fig_one, fig_two))

biểu đồ cột cơ bản

Trực quan hóa dữ liệu tương tác với Bokeh

Tạo gridplot

from bokeh.layouts import gridplot

positions = ["PG", "SG", "SF", "PF"]
plots = []
for position in positions:
nba_positions = nba.loc[nba["position"] == position] source = ColumnDataSource(data=nba_positions)
fig = figure(x_axis_label="Assists", y_axis_label="Points")
fig.circle(x="assists", y="points", source=source, legend_label=position)
plots.append(fig)
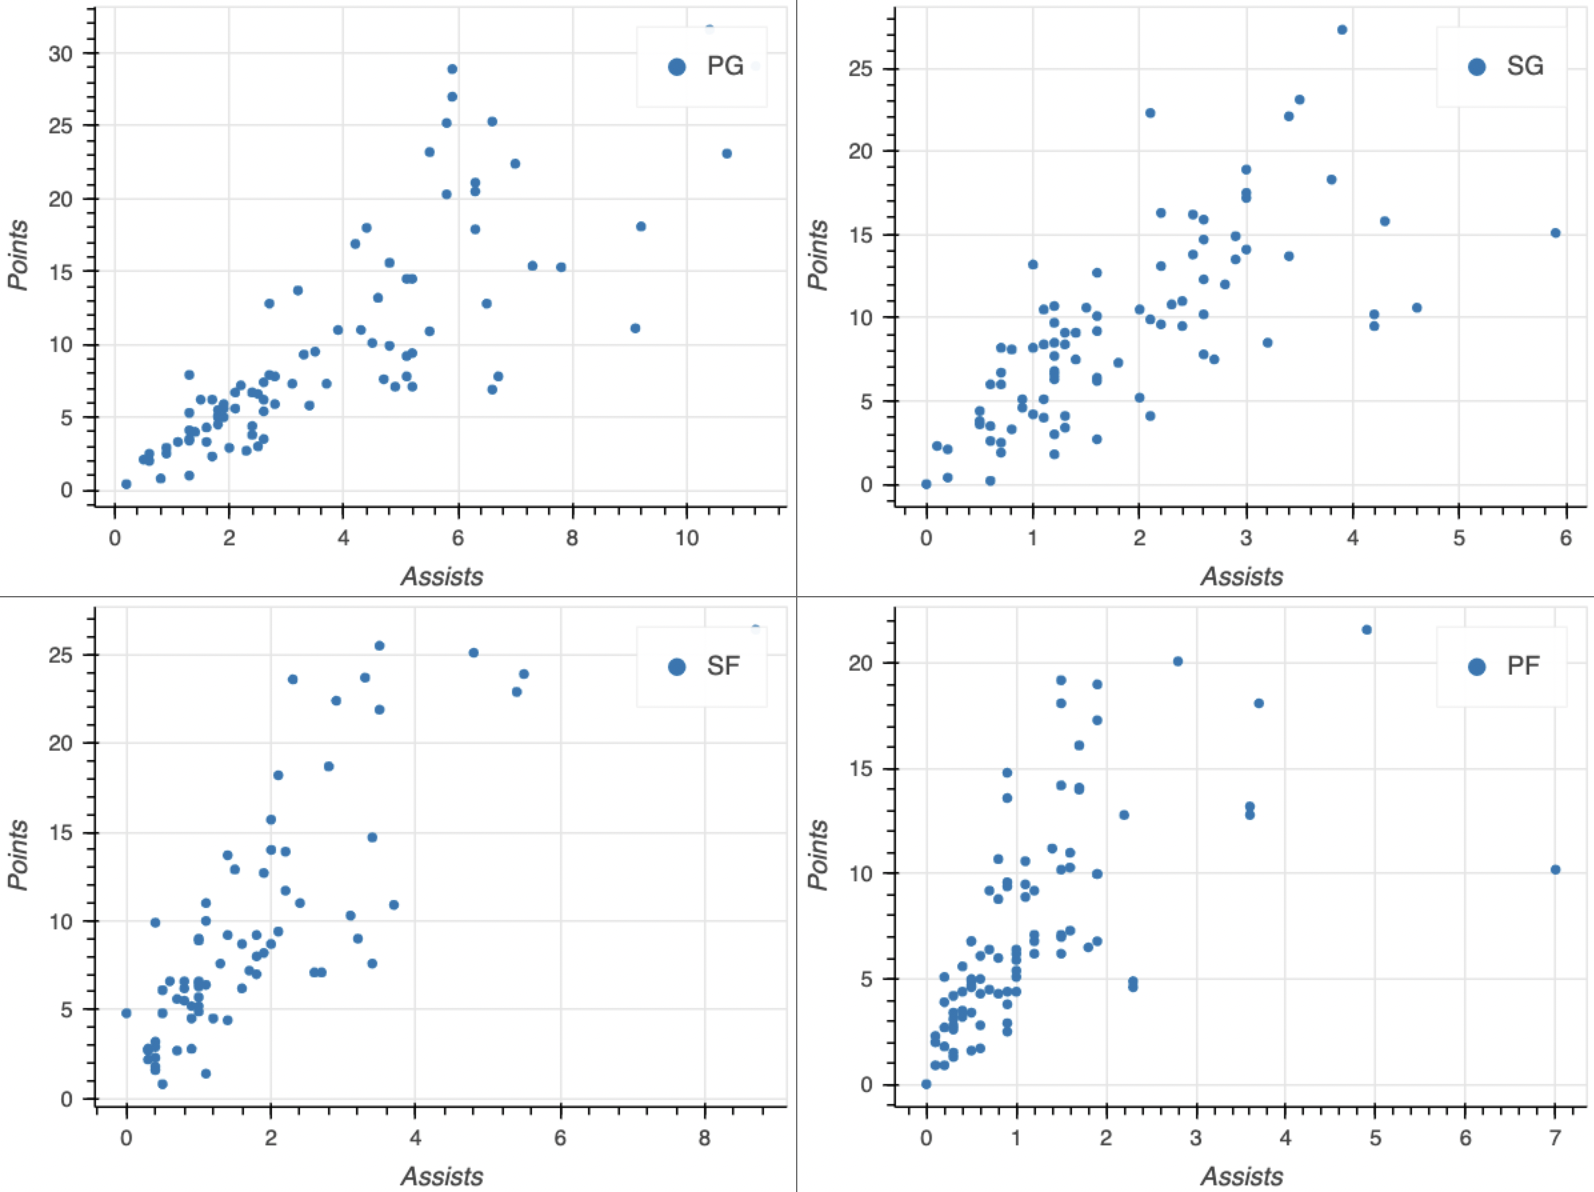
output_file(filename="nba_gridplot.html") show(gridplot(plots, ncols=2))
Trực quan hóa dữ liệu tương tác với Bokeh

Gridplot

gridplot

Trực quan hóa dữ liệu tương tác với Bokeh

Tùy chỉnh kích thước figure

fig = figure(x_axis_label="Assists", y_axis_label="Rebounds",

width=750, height=300)
fig.circle(x="assists", y="rebounds", source=source) output_file(filename="custom_size_plot.html") show(fig)
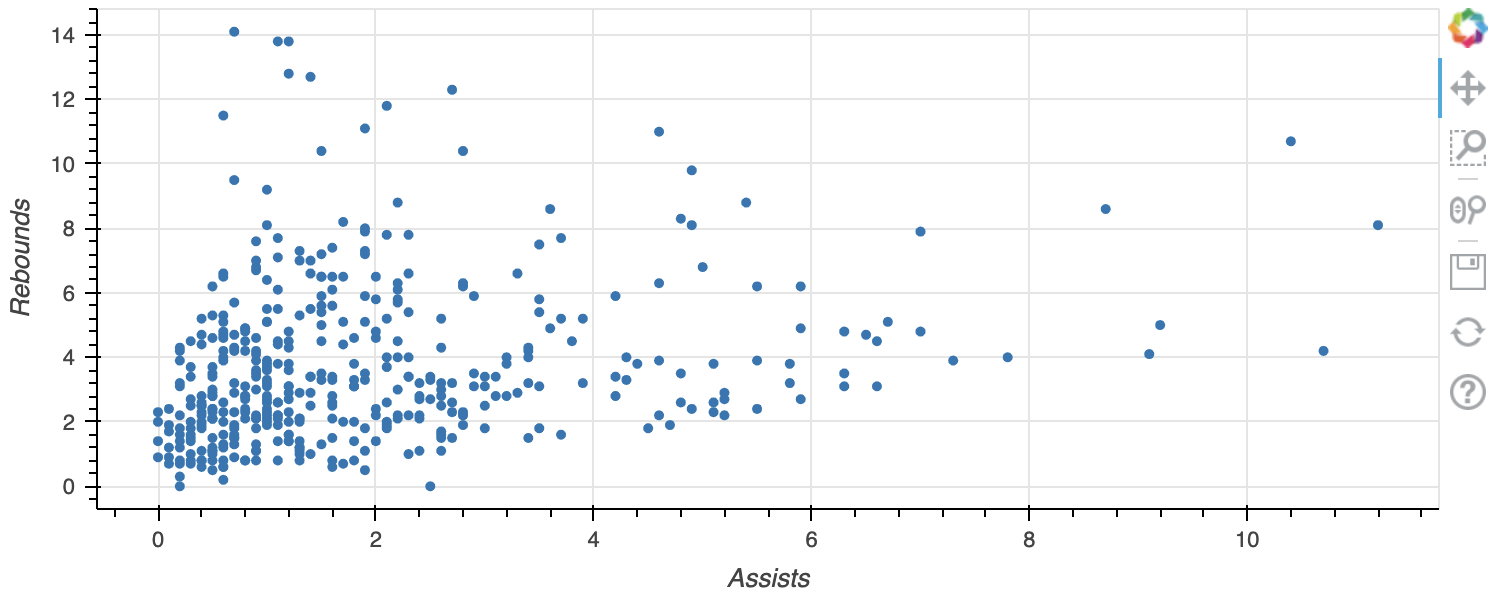
custom_size_plot

Trực quan hóa dữ liệu tương tác với Bokeh

Ayo berlatih!

Trực quan hóa dữ liệu tương tác với Bokeh

Preparing Video For Download...