Widget Select

Trực quan hóa dữ liệu tương tác với Bokeh

George Boorman

Core Curriculum Manager, DataCamp

Widget Select
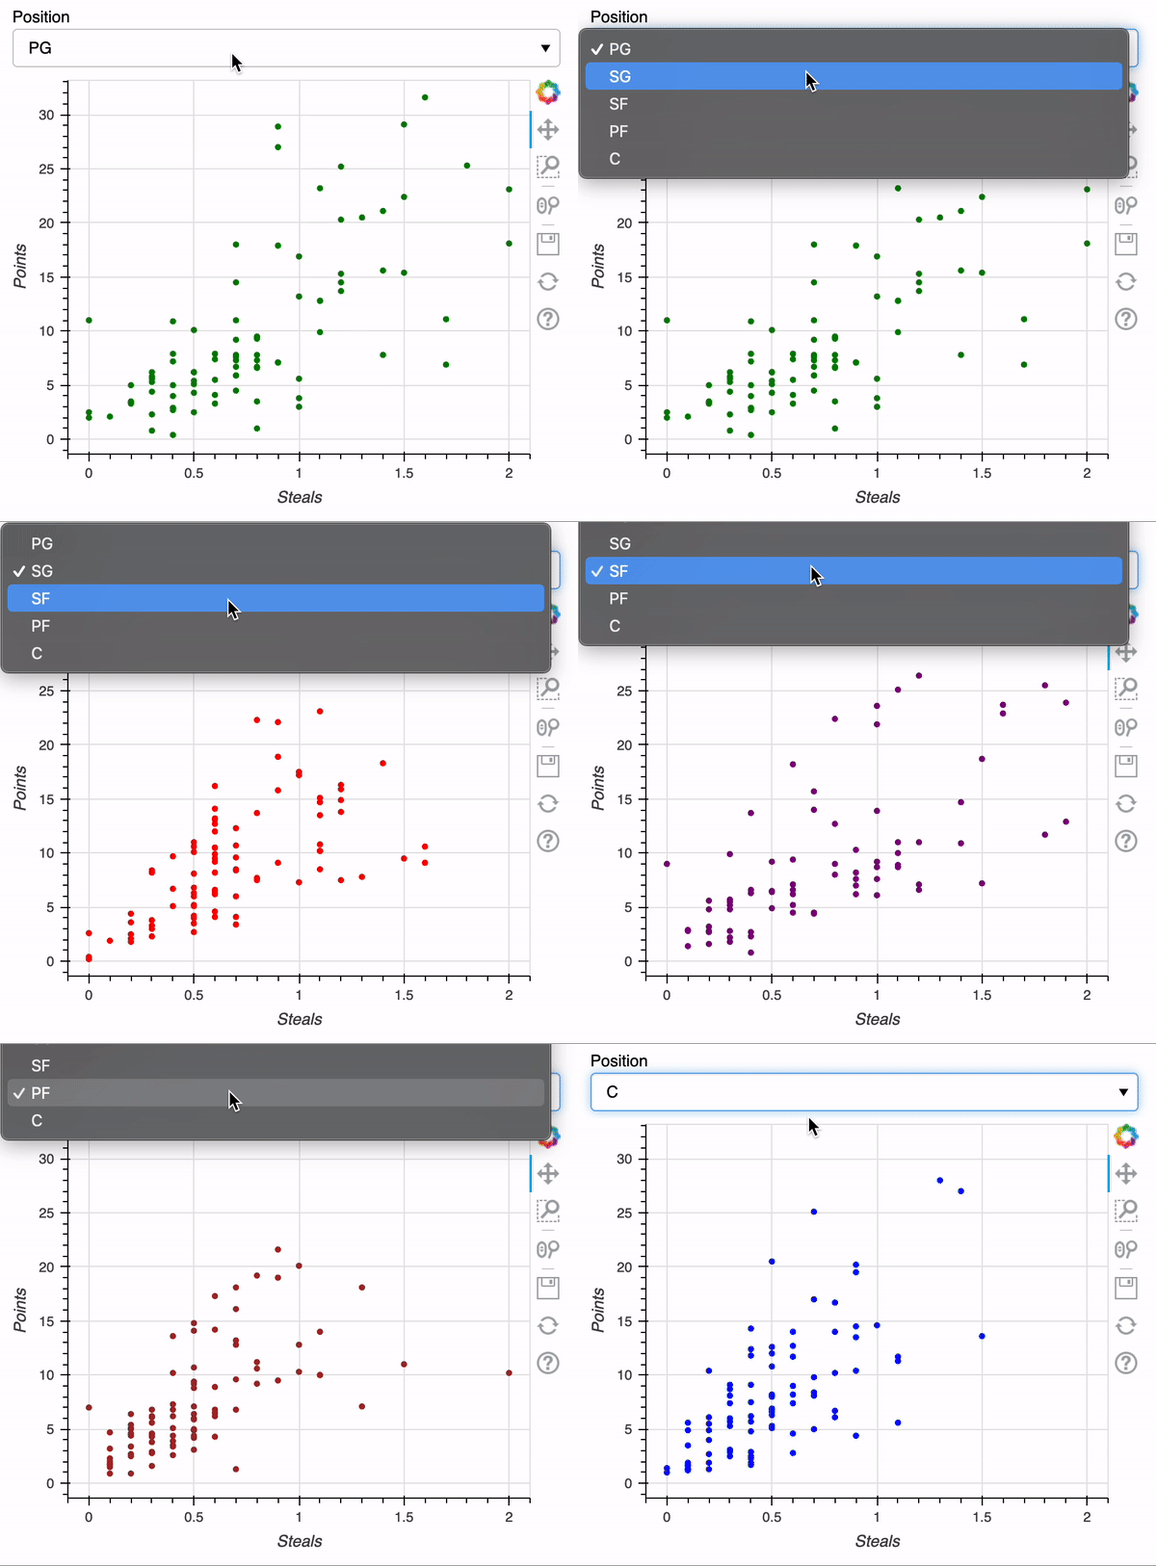
Select_scatter_gif

Trực quan hóa dữ liệu tương tác với Bokeh

JavaScript

Logo JavaScript

Trực quan hóa dữ liệu tương tác với Bokeh

Thiết lập widget Select

from bokeh.models import Select, CustomJS

fig = figure(x_axis_label="Rebounds", y_axis_label="Points") east_glyph = fig.circle(x="rebounds", y="points", color="green", source=east) west_glyph = fig.circle(x="rebounds", y="points", color="red", source=west) west_glyph.visible = False
menu = ["East", "West"]
Trực quan hóa dữ liệu tương tác với Bokeh

Xây dựng hàm tương tác

callback = CustomJS(args=dict(scatter_1=east_glyph, scatter_2=west_glyph),

code="""scatter_1.visible = true scatter_2.visible = true if (this.value == "East") {scatter_2.visible = false} else {scatter_1.visible = false}""")
menu = Select(options=menu, value="East", title="Conference")
menu.js_on_change("value", callback)
output_file(filename="select_widget.html") layout=column(menu, fig) show(layout)
Trực quan hóa dữ liệu tương tác với Bokeh

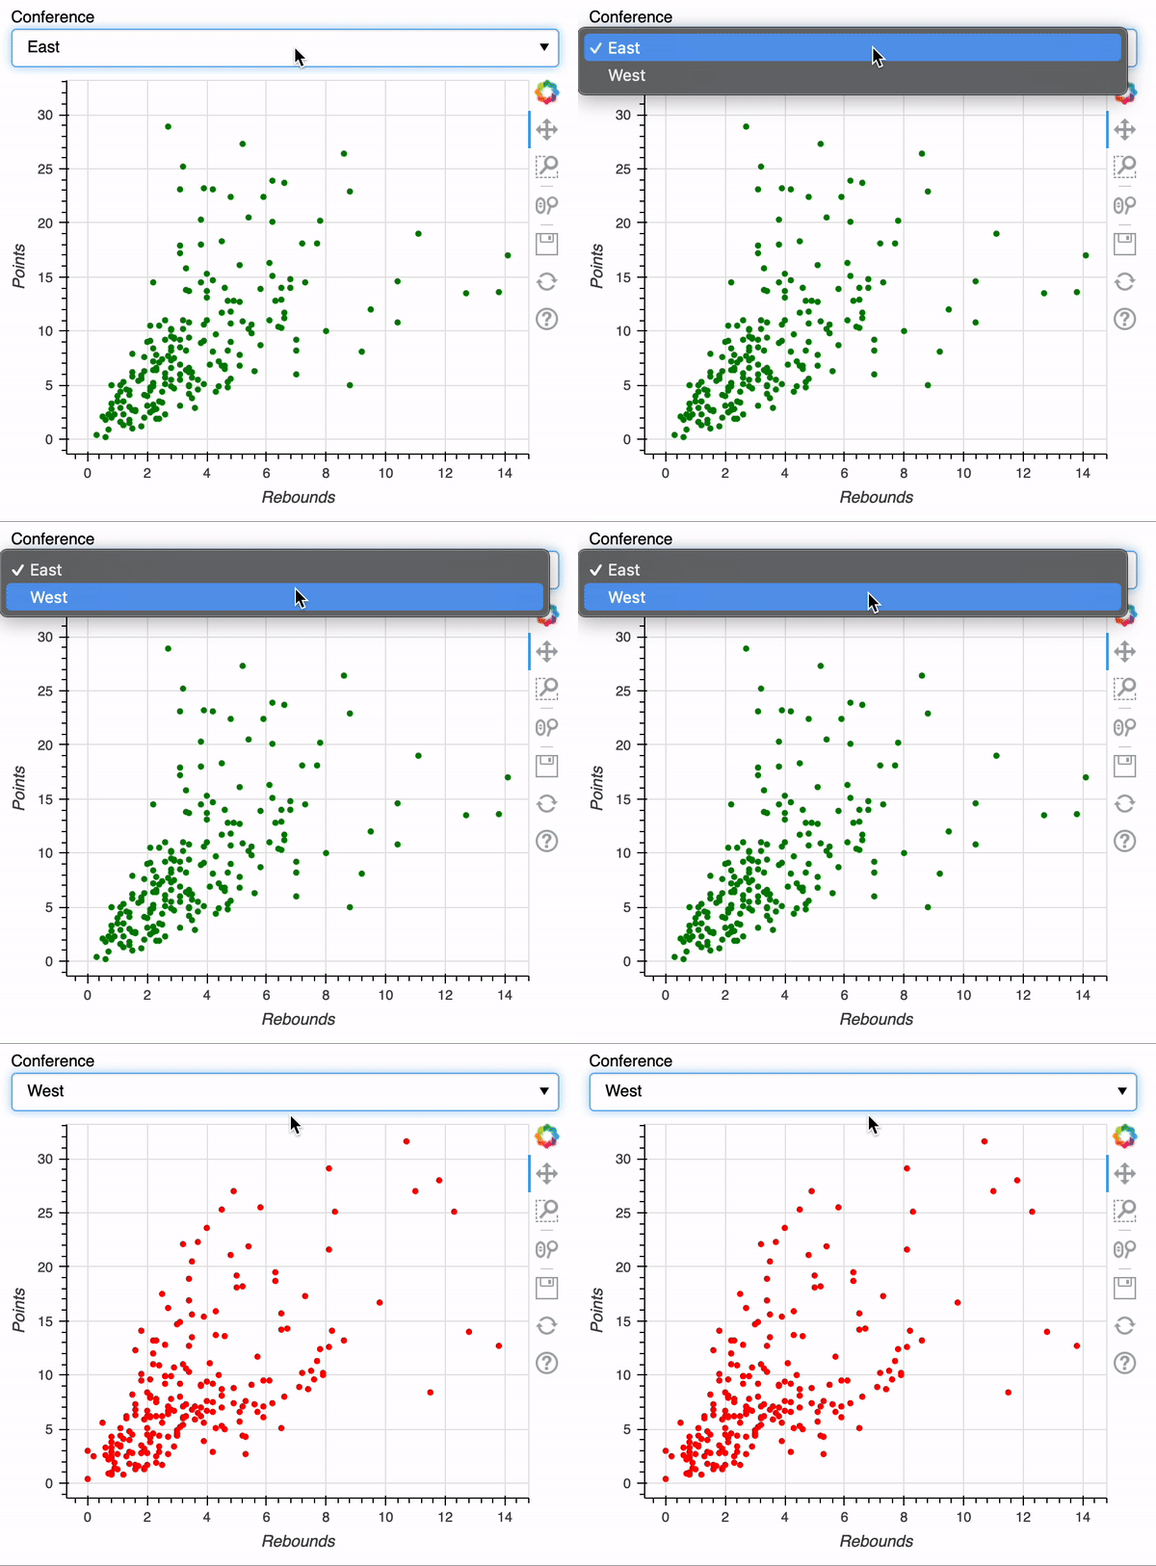
Kết quả

Kết quả hai tùy chọn Select

Trực quan hóa dữ liệu tương tác với Bokeh

Chọn từ ba tùy chọn

fig = figure(x_axis_label="Date", y_axis_label="Sales")
north_glyphs = fig.line(x="date", y="price", color="green", source=north)
east_glyphs = fig.line(x="date", y="price", color="red", source=east)
south_glyphs = fig.line(x="date", y="price", color="purple", source=south)
fig.xaxis[0].formatter = DatetimeTickFormatter(months="%b %Y")
fig.yaxis[0].formatter = NumeralTickFormatter(format="$0a")
east_glyphs.visible = False
south_glyphs.visible = False
menu = Select(options=["North", "East", "South"], value="North", title="Region")
Trực quan hóa dữ liệu tương tác với Bokeh

Tạo ba tương tác

callback = CustomJS(args=dict(line_1=north_glyphs, line_2=east_glyphs,
                             line_3=south_glyphs), code="""
                             line_1.visible = true
                             line_2.visible = true
                             line_3.visible = true
                             if (this.value == "North") {line_2.visible = false
                                 line_3.visible = false} else {line_1.visible = false}
                             if (this.value == "East") {line_1.visible = false
                                 line_3.visible = false} else {line_2.visible = false}
                             if (this.value == "South") {line_1.visible = false
                                 line_2.visible = false} else {line_3.visible = false}""")

menu.js_on_change("value", callback) output_file(filename="melbourne_regions_widget.html") layout=column(menu, fig) show(layout)
Trực quan hóa dữ liệu tương tác với Bokeh

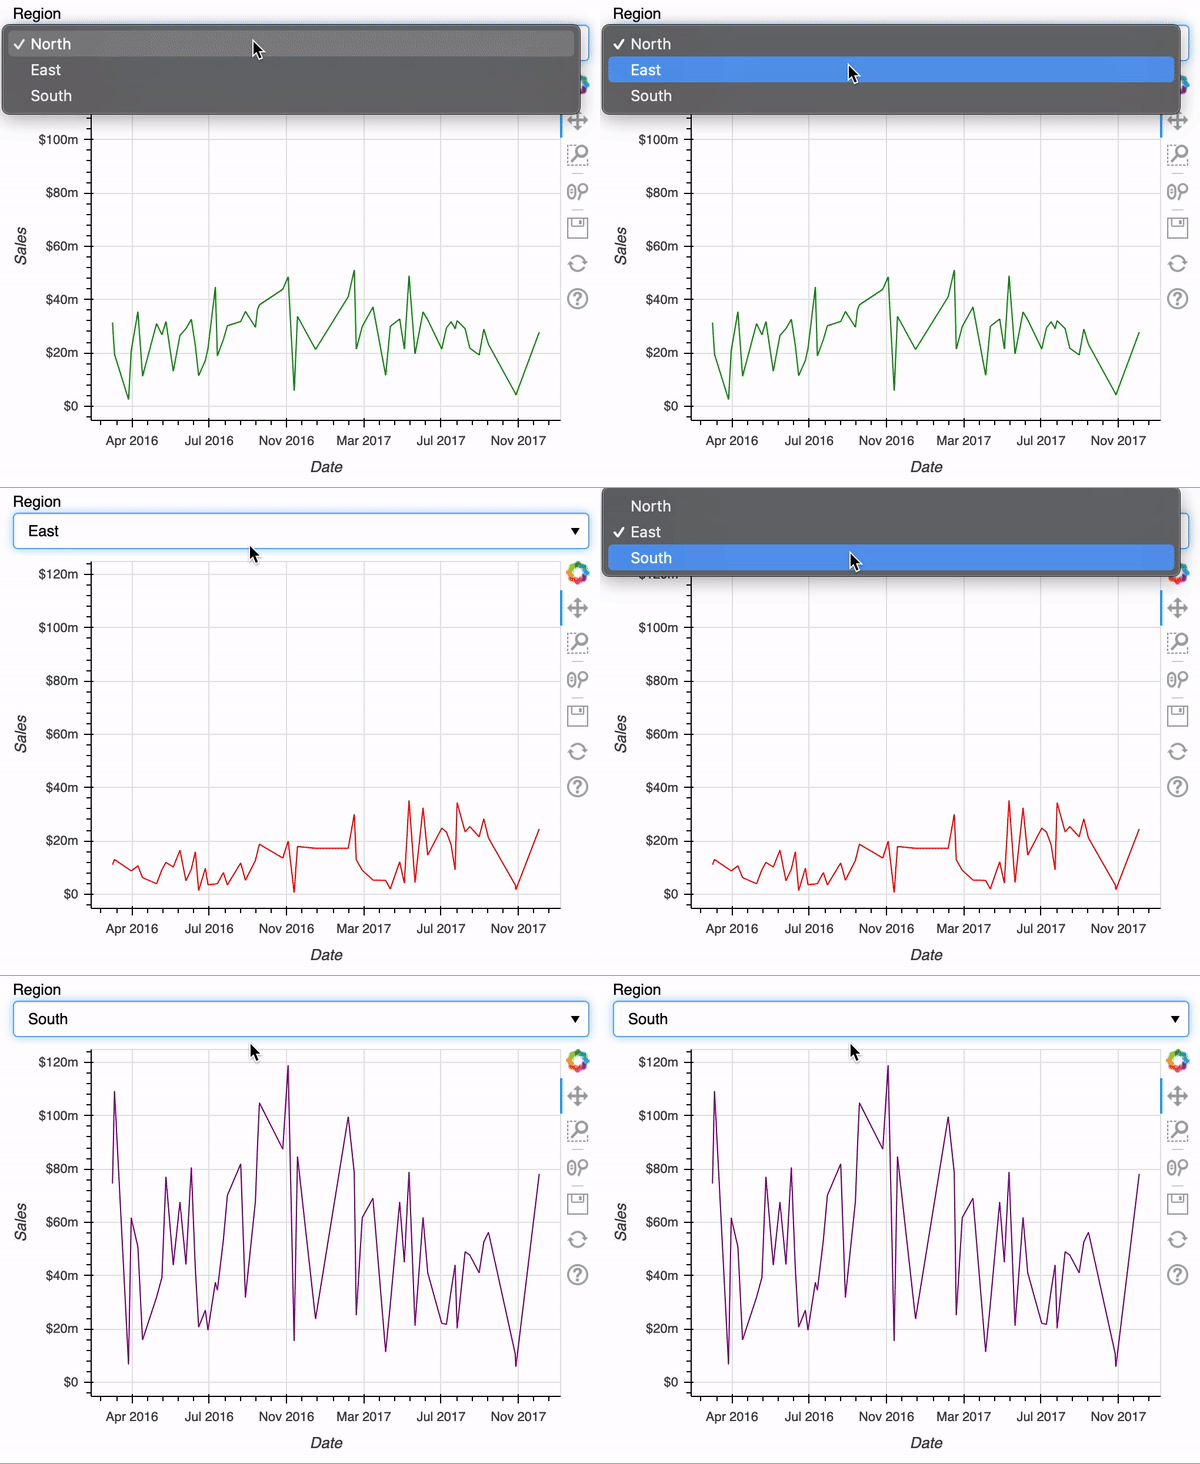
Widget Select với biểu đồ đường

Widget Select với biểu đồ đường

Trực quan hóa dữ liệu tương tác với Bokeh

Dùng Select cho các figure khác nhau

stocks["market_cap"] = stocks["volume"] * stocks["close"]
ebay = stocks.loc[stocks["name"] == "EBAY"]
source = ColumnDataSource(data=ebay)

fig = figure(x_axis_label="Date", y_axis_label="Stock Price") fig_two = figure(x_axis_label="Date", y_axis_label="Market Cap") fig_three = figure(x_axis_label="Date", y_axis_label="Volume") price = fig.line(x="date", y="close", color="green", source=source) market_cap = fig_two.line(x="date", y="market_cap", color="red", source=source) volume = fig_three.line(x="date", y="volume", color="purple", source=source)
fig_two.visible = False fig_three.visible = False market_cap.visible = False volume.visible = False
Trực quan hóa dữ liệu tương tác với Bokeh

Xây dựng tương tác giữa figure

menu = Select(options=["Price", "Market Cap", "Volume"], value="Price", title="Metric") 
callback = CustomJS(args=dict(plot_one=fig, plot_two=fig_two, plot_three=fig_three, 
                              line_1=price, line_2=market_cap, line_3=volume),

code=""" plot_one.visible = true plot_two.visible = true plot_three.visible = true line_1.visible = true line_2.visible = true line_3.visible = true if (this.value == "Price") {plot_two.visible = false plot_three.visible = false line_2.visible = false line_3.visible = false} else {plot_one.visible = false line_1.visible = false}
Trực quan hóa dữ liệu tương tác với Bokeh

Hoàn thiện callback

"""
if (this.value == "Market Cap") {plot_one.visible = false
                                 plot_three.visible = false
                                 line_1.visible = false
                                 line_3.visible = false} 
    else {plot_two.visible = false
          line_2.visible = false}
if (this.value == "Volume") {plot_one.visible = false
                             plot_two.visible = false
                             line_1.visible = false
                             line_2.visible = false}
    else {plot_three.visible = false
          line_3.visible = false}
""")
menu.js_on_change("value", callback)

output_file(filename="multiple_figures,html") layout=layout([menu], [fig, fig_two, fig_three]) show(layout)
Trực quan hóa dữ liệu tương tác với Bokeh

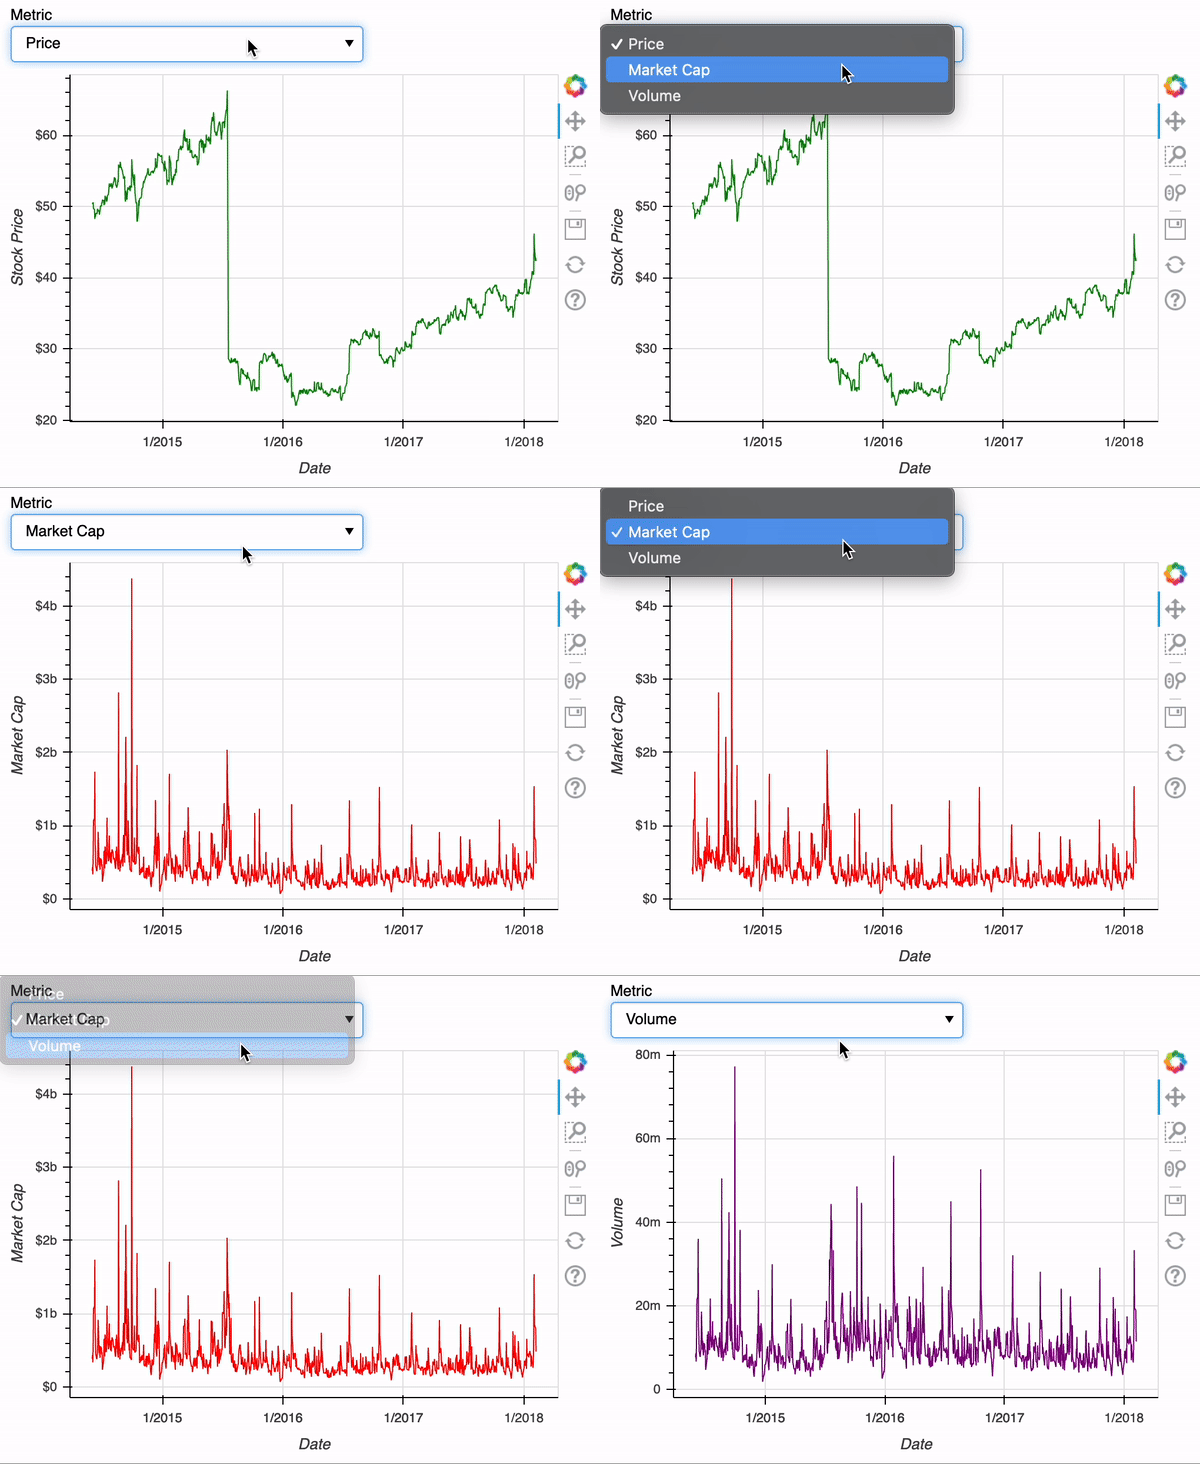
Chuyển đổi figure

Chuyển đổi giữa nhiều figure

Trực quan hóa dữ liệu tương tác với Bokeh

Hãy thực hành!

Trực quan hóa dữ liệu tương tác với Bokeh

Preparing Video For Download...