Trực quan hóa dữ liệu phân loại

Trực quan hóa dữ liệu tương tác với Bokeh

George Boorman

Core Curriculum Manager, DataCamp

Dữ liệu phân loại

  • Dữ liệu phân loại là dữ liệu có số lượng lựa chọn hoặc nhãn cố định.

    • Ví dụ: giới tính hoặc quốc gia nơi sinh.
  • Factor là cách gọi khác của biến phân loại

print(nba[["position", "team", "conference"]].head())
    position    team    conference
0   PG          OKC     West
1   PG          HOU     West
2   PG          BOS     East
3   C           NO      West
4   SG          TOR     East
Trực quan hóa dữ liệu tương tác với Bokeh

Sắp xếp

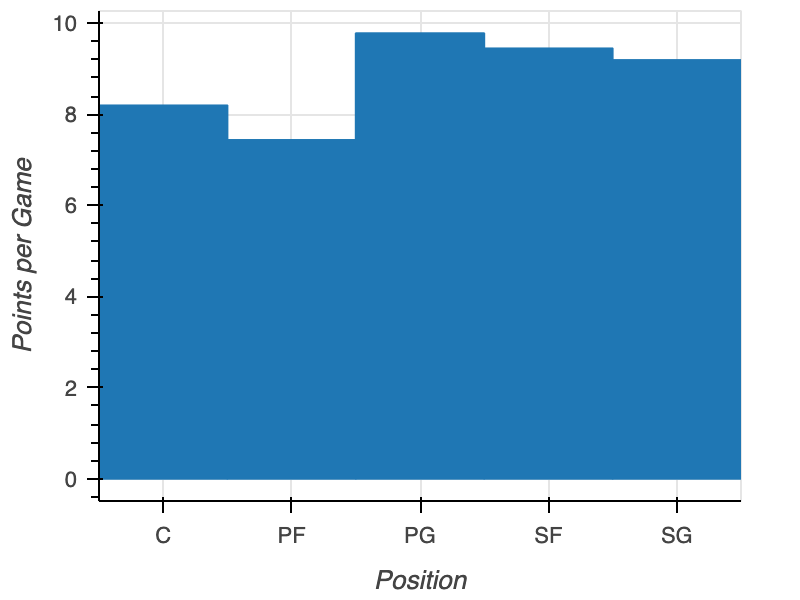
biểu đồ cột chưa sắp xếp

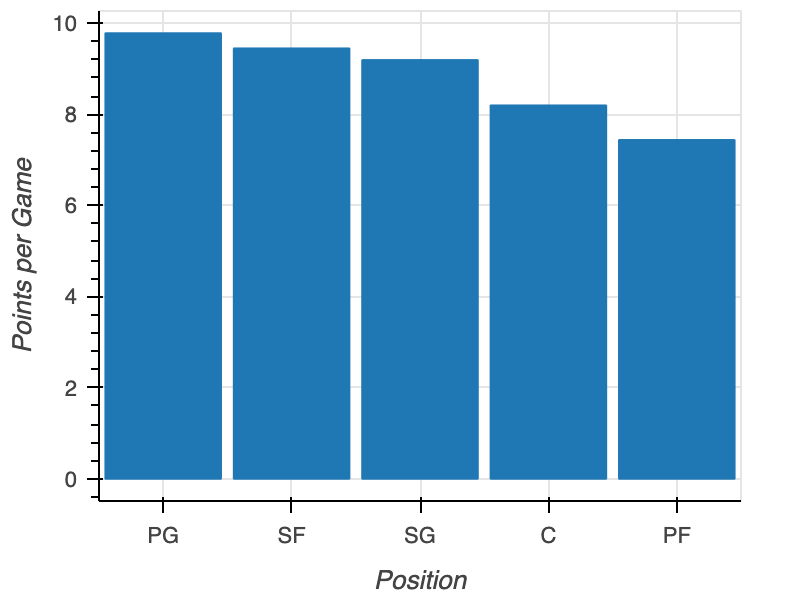
pos = nba.groupby("position")["points"].mean()
pos = pos.sort_values("points", ascending=False)

fig = figure(x_range=pos["position"], x_axis_label="Position", y_axis_label="Points per Game") fig.vbar(x=pos["position"], top=pos["points"]) output_file(filename="sorted_plot.html") show(fig)
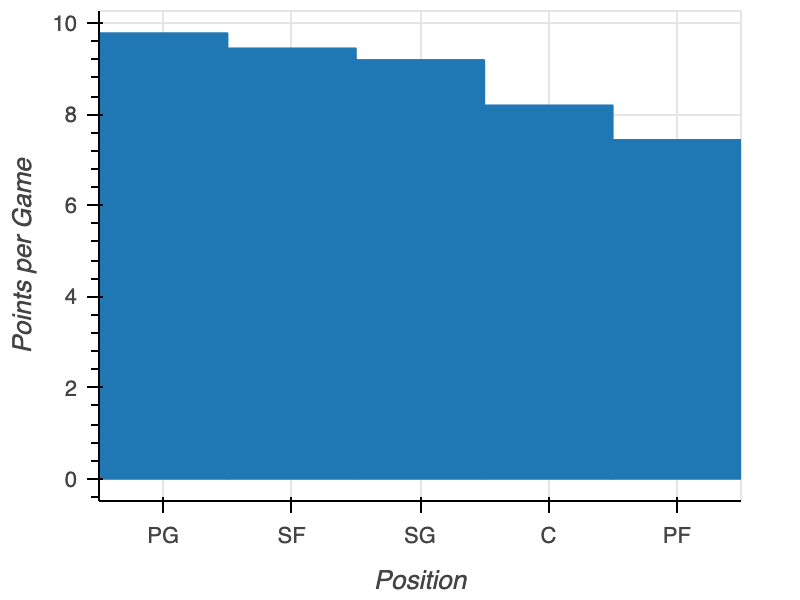
biểu đồ cột đã sắp xếp

Trực quan hóa dữ liệu tương tác với Bokeh

Chừa lề

fig = figure(x_range=nba["position"], 
             x_axis_label="Position", 
             y_axis_label="Points per Game")
fig.vbar(x=nba["position"], top=nba["points"],

width=0.9)
output_file(filename="padded_plot.html") show(fig)

biểu đồ cột đã sắp xếp có chừa lề

Trực quan hóa dữ liệu tương tác với Bokeh

Hướng

fig = figure(x_range=nba['position'], 
             x_axis_label="Position", 
             y_axis_label="Points per Game")
fig.vbar(x=nba["position"], top=nba["points"], width=0.9)

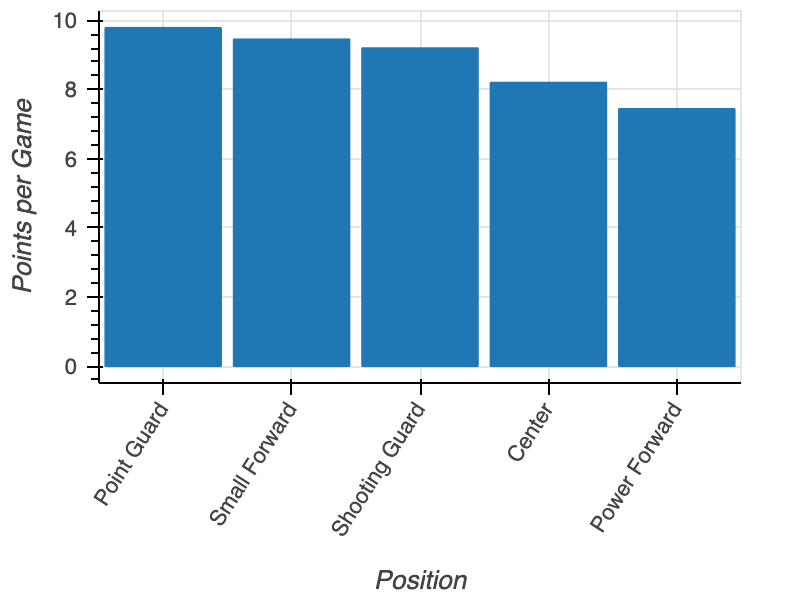
fig.xaxis.major_label_orientation = 45
output_file(filename="rotated_x_label_plot.html") show(fig)
Trực quan hóa dữ liệu tương tác với Bokeh

Xoay nhãn trục x

biểu đồ với nhãn trục x xoay

Trực quan hóa dữ liệu tương tác với Bokeh

Danh mục lồng nhau

positions = ["Point Guard", "Shooting Guard", 
            "Small Forward", "Power Forward", "Center"]
conferences = ["East", "West"]

factors = [("Point Guard", "East"), ("Point Guard", "West"), ("Shooting Guard", "East"), ("Shooting Guard", "West"), ("Small Forward", "East"), ("Small Forward", "West"), ("Power Forward", "East"), ("Power Forward", "West"), ("Center", "East"), ("Center", "West")]
Trực quan hóa dữ liệu tương tác với Bokeh

Tạo biểu đồ cột nhóm

from bokeh.models import FactorRange

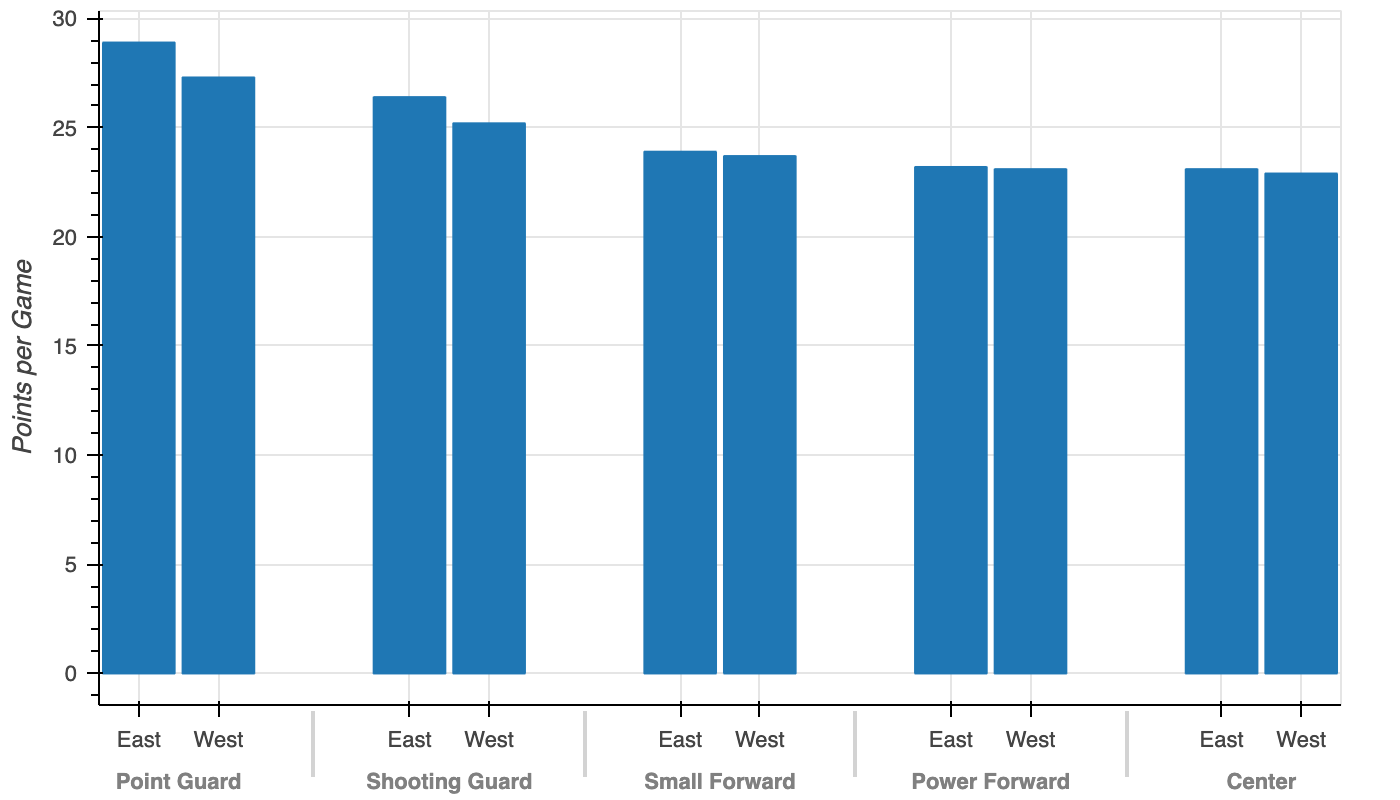
fig = figure(x_range=FactorRange(*factors), y_axis_label="Points per Game")
fig.vbar(x=factors, top=nba["points"], width=0.9)
output_file(filename="grouped_bar_plot.html") show(fig)
Trực quan hóa dữ liệu tương tác với Bokeh

Biểu đồ cột nhóm

biểu đồ cột nhóm

Trực quan hóa dữ liệu tương tác với Bokeh

Hãy thực hành!

Trực quan hóa dữ liệu tương tác với Bokeh

Preparing Video For Download...