Giới thiệu về Bokeh

Trực quan hóa dữ liệu tương tác với Bokeh

George Boorman

Core Curriculum Manager, DataCamp

Bokeh là gì?
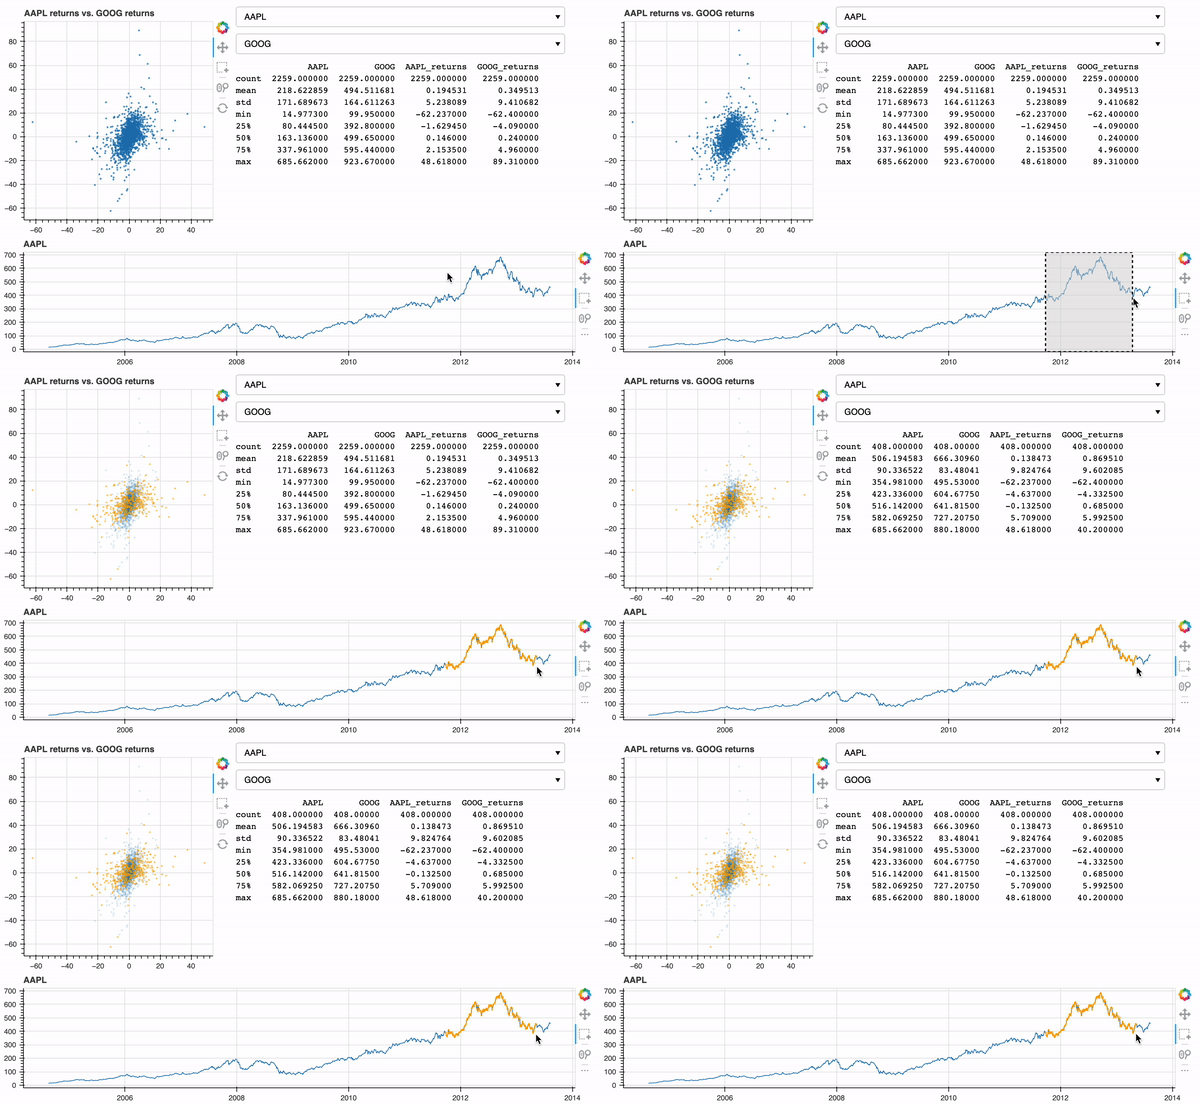
tài liệu

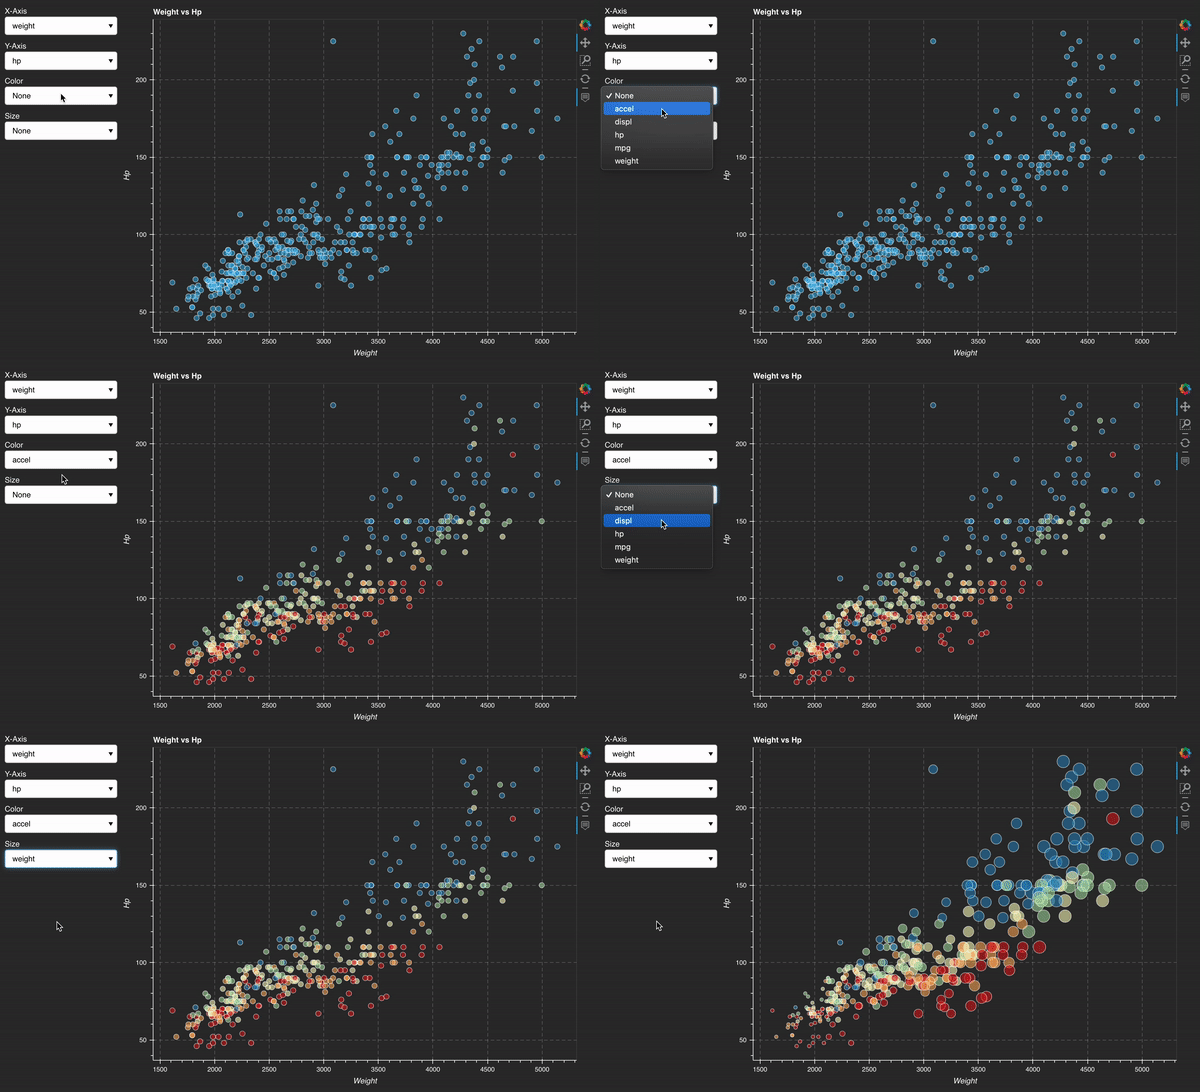
tương tác xe

Trực quan hóa dữ liệu tương tác với Bokeh

Tổng quan khóa học

  • Chương 1: Giới thiệu về Bokeh
  • Chương 2: Tùy chỉnh trực quan hóa
  • Chương 3: Kể chuyện bằng trực quan hóa
  • Chương 4: Giới thiệu về tiện ích
Trực quan hóa dữ liệu tương tác với Bokeh
import pandas as pd
nba = pd.read_csv("nba.csv")
print(nba.columns)
Index(['player', 'position', 'minutes', 'field_goal_perc', 'three_point_perc',
       'free_throw_perc', 'rebounds', 'assists', 'steals', 'blocks', 'points',
       'team', 'conference', 'scorer_category'],
      dtype='object')
print(nba.shape)
(424, 14)
Trực quan hóa dữ liệu tương tác với Bokeh

Thiết lập figure

from bokeh.plotting import figure

from bokeh.io import output_file, show
fig = figure()
output_file(filename="empty_figure.html")
show(fig)

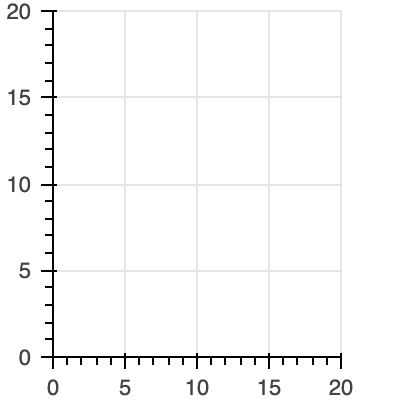
hình trống

Trực quan hóa dữ liệu tương tác với Bokeh

Tạo biểu đồ phân tán

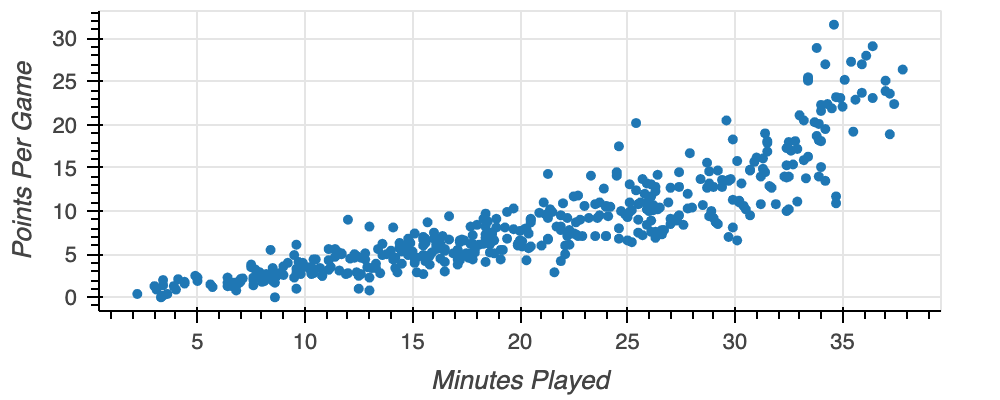
fig = figure(x_axis_label="Minutes Played", y_axis_label="Points Per Game")

fig.circle(x=nba["minutes"], y=nba["points"])
output_file(filename="nba_points.html") show(fig)

biểu đồ phân tán nba

Trực quan hóa dữ liệu tương tác với Bokeh

Hiển thị biểu đồ đường

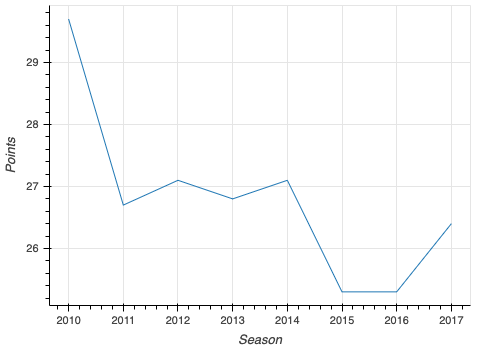
fig = figure(x_axis_label="Season", y_axis_label="Points")

fig.line(x=lebron["season"], y=lebron["points"])
output_file(filename="lebron_points_per_season.html") show(fig)

đường Lebron

Trực quan hóa dữ liệu tương tác với Bokeh

Vẽ dữ liệu phân loại

positions = nba.groupby("position", as_index=False)["points"].mean()

fig = figure(x_axis_label="Position", y_axis_label="Points per Game",
x_range=positions["position"])
fig.vbar(x=positions["position"], top=positions["points"])
output_file(filename="nba_points_by_position.html") show(fig)
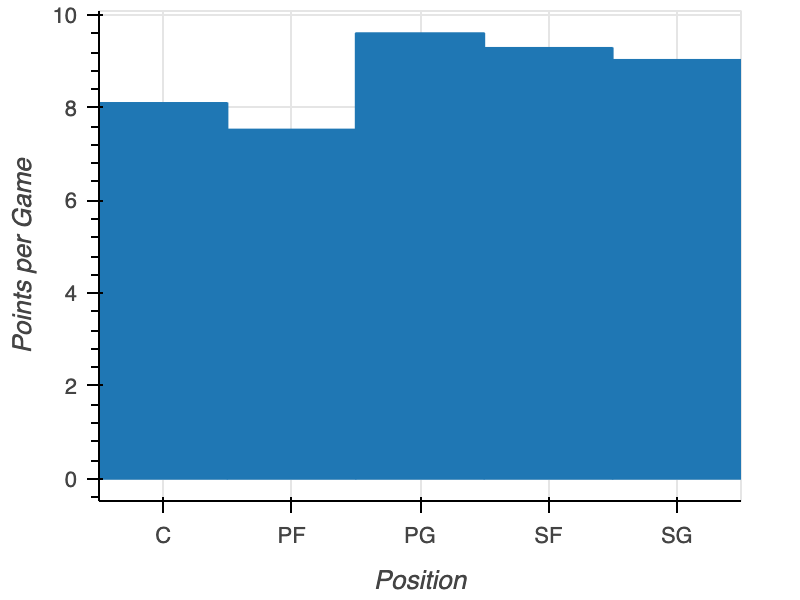
nba_theo_vị_trí

Trực quan hóa dữ liệu tương tác với Bokeh

Ayo berlatih!

Trực quan hóa dữ liệu tương tác với Bokeh

Preparing Video For Download...