Giới thiệu & Động lực
Phát hiện gian lận với R

Bart Baesens
Professor Data Science at KU Leuven
Giảng viên

Giảng viên

Giảng viên

Gian lận là gì?
Gian lận là tội phạm hiếm gặp, có tính toán kỹ, che giấu tinh vi, biến đổi theo thời gian và thường được tổ chức cẩn thận, xuất hiện dưới nhiều dạng.

Đặc điểm then chốt của mô hình phân tích gian lận hiệu quả

Đặc điểm then chốt của mô hình phân tích gian lận hiệu quả

Đặc điểm then chốt của mô hình phân tích gian lận hiệu quả

Đặc điểm then chốt của mô hình phân tích gian lận hiệu quả

Đặc điểm then chốt của mô hình phân tích gian lận hiệu quả

Thách thức của mô hình phát hiện gian lận

Thách thức của mô hình phát hiện gian lận

Thách thức của mô hình phát hiện gian lận

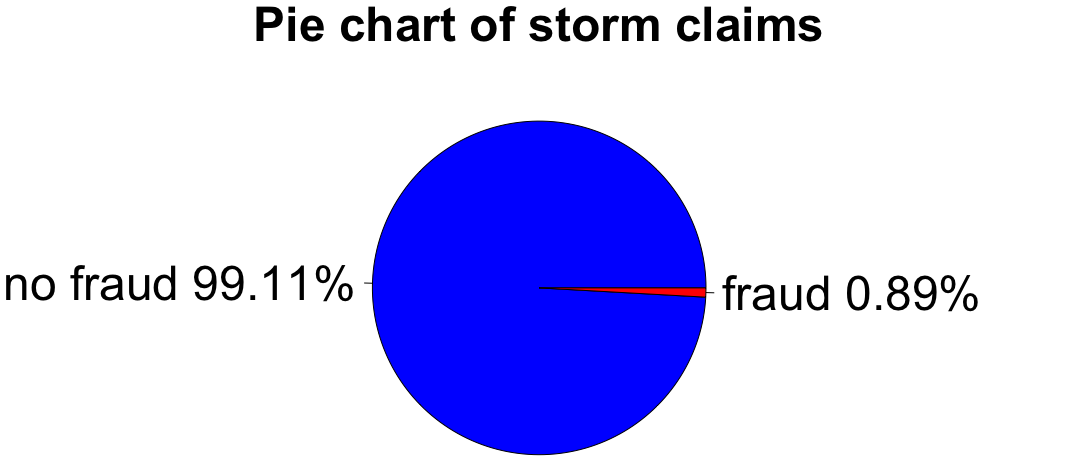
Trực quan mất cân bằng với biểu đồ tròn
labels <- c("no fraud", "fraud")
labels <- paste(labels, round(100 * prop.table(table(fraud_label)), 2), "%")
pie(table(fraud_label), labels, col = c("blue", "red"),
      main = "Pie chart of storm claims")
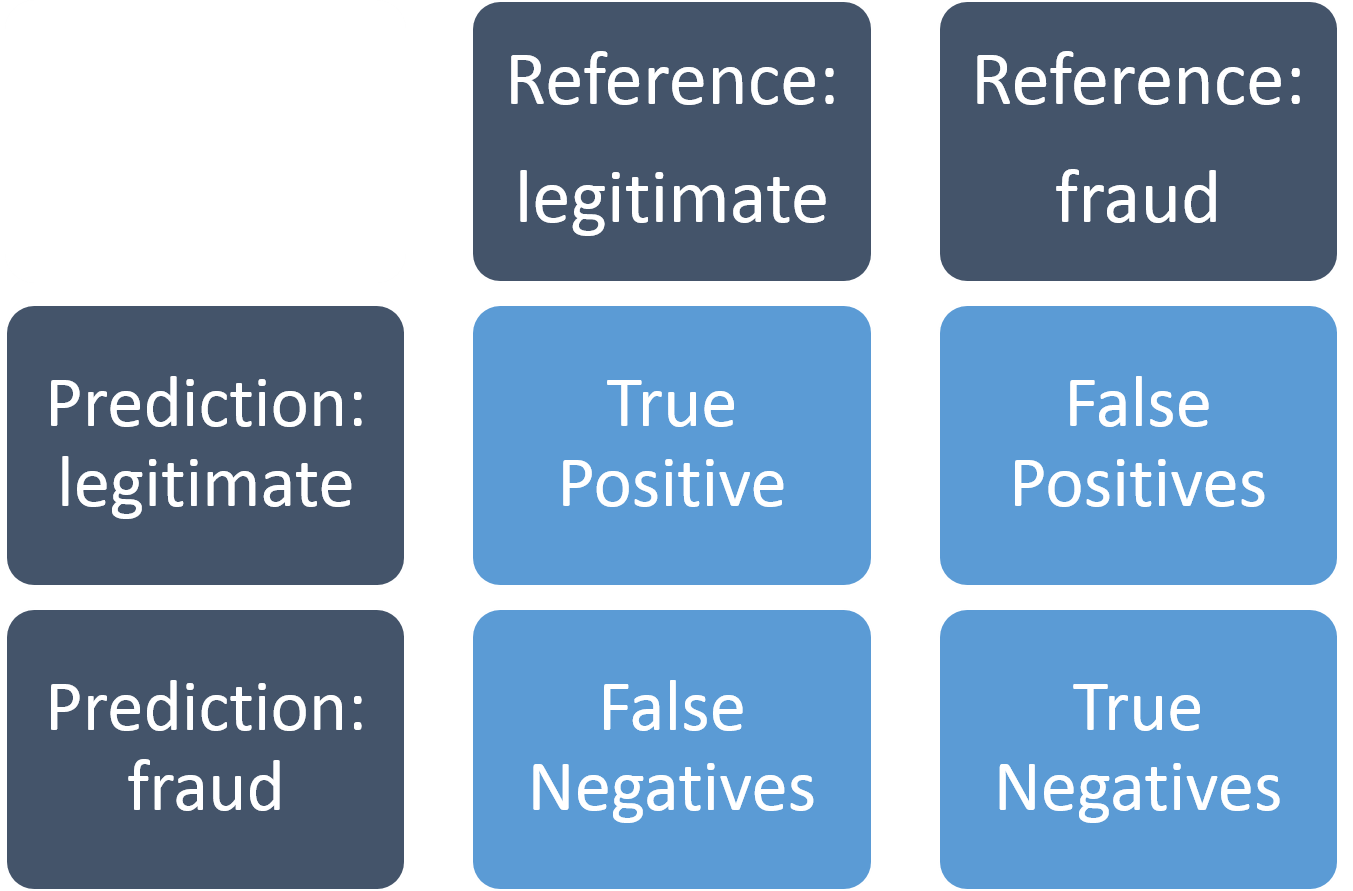
Ma trận nhầm lẫn
Dùng để đánh giá mô hình phát hiện gian lận: