Xử lý dữ liệu trong Julia
Katerina Zahradova
Instructor
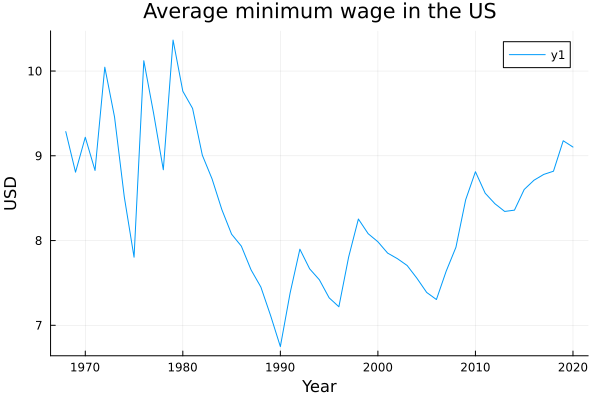
Row year mean_min_wage_2020_dollars
Int64 Float64
________________________________
1 1968 9.28529
2 1969 8.80667
3 1970 9.21882
4 1971 8.82686
5 1972 10.0457
...

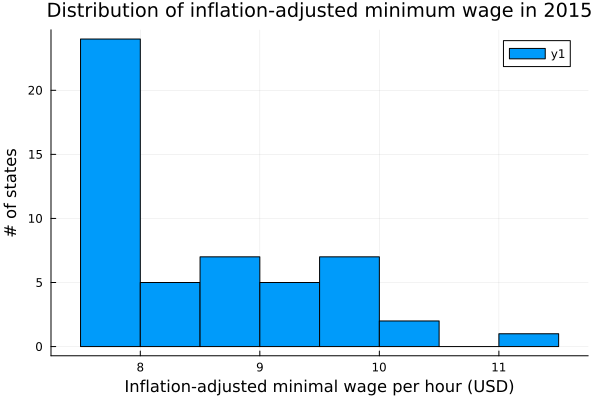
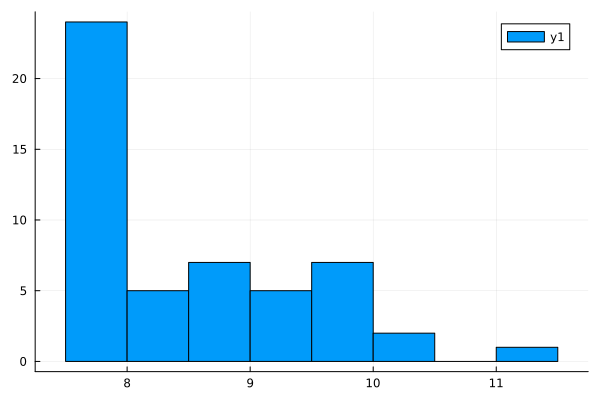
# Vẽ histogram với số bins mặc định
wages_2015 = filter(wages.year == 2015, wages)
histogram(wages_2015.eff_min_wage_2020_dollars)
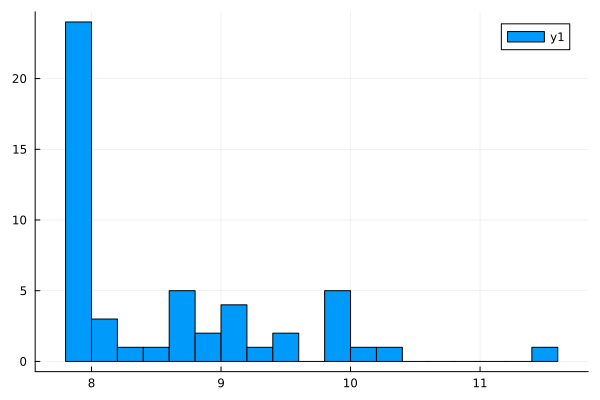
# Chỉ định số bins
wages_2015 = filter(wages.year == 2015, wages)
histogram(wages_2015.eff_min_wage_2020_dollars,
bins = 25)
# Tạo histogram wages_2015 = filter(wages.year == 2015, wages) histogram(wages_2015.eff_min_wage_2020_dollars)# Thêm nhãn trục x xlabel!("Lương tối thiểu/giờ (USD, đã điều chỉnh lạm phát)")# Thêm nhãn trục y ylabel!("Số bang")# Thêm tiêu đề title!("Phân phối lương tối thiểu (điều chỉnh lạm phát) năm 2015")

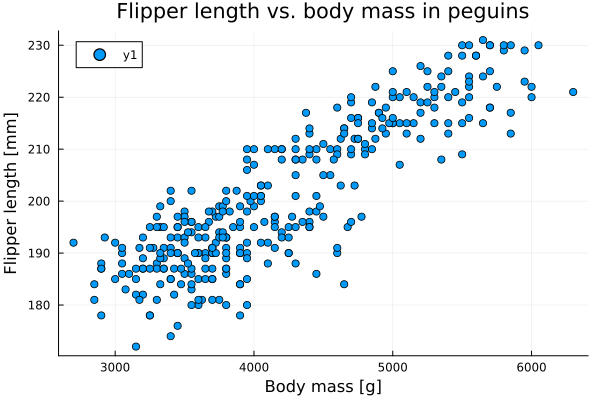
# Scatter plot
scatter(penguins.body_mass_g,
penguins.flipper_length_mm)
# Labels
xlabel!("Khối lượng [g]")
ylabel!("Độ dài vây [mm]")
title!("Độ dài vây vs.
khối lượng ở chim cánh cụt")

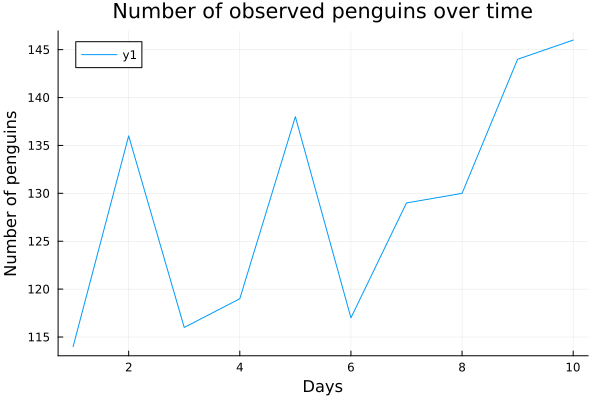
# Số chim cánh cụt Adelie theo thời gian
plot(observations.days,
observations.adelie)
# Labels
xlabel!("Ngày")
ylabel!("Số lượng chim")
title!("Số chim quan sát được
theo thời gian")

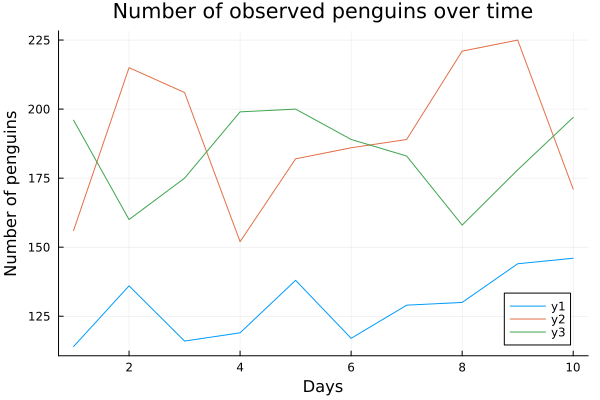
# Vẽ đường đầu tiên plot(observations.day, observations.adelie)# Thêm và chỉnh với các đường mới plot!(observations.day, observations.chinstrap) plot!(observations.day, observations.gentoo)# Labels xlabel!("Ngày") ylabel!("Số lượng chim") title!("Số chim quan sát được theo thời gian")

# Tạo biểu đồ
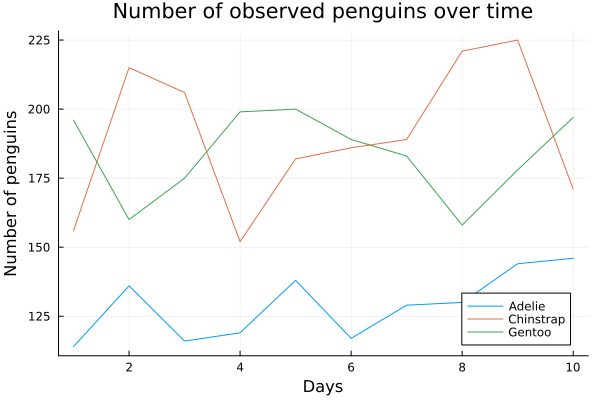
plot(observations.day, observatations.adelie,
label = "Adelie" )
plot!(observations.day, observations.chinstrap,
label = "Chinstrap")
plot!(observations.day, observations.gentoo,
label = "Gentoo")
# Labels
xlabel!("Ngày")
ylabel!("Số lượng chim")
title!("Số chim quan sát được theo thời gian")

Các loại biểu đồ:
Histogram - phân phối biến số
histogram(df.n1, label = "n1")
Biểu đồ phân tán - quan hệ giữa hai biến số
scatter(df.x, df.y, label = "y")
Biểu đồ đường - diễn biến theo thời gian
plot(df.x, df.y, label = "y")
Thêm một đường vào biểu đồ hiện có:
histogram!(df.n2, label = "n2")scatter!(df.x2, df.y2, label = "y2")plot!(df.x2, df.y2, label = "y2")Nhãn:
xlabel!("Văn bản nhãn trục x")ylabel!("Văn bản nhãn trục y")title!("Văn bản tiêu đề")Xử lý dữ liệu trong Julia