Thuộc tính biểu đồ và bảng màu

Nhập môn Trực quan hóa Dữ liệu với Julia

Gustavo Vieira Suñe

Data Analyst

Bảng màu

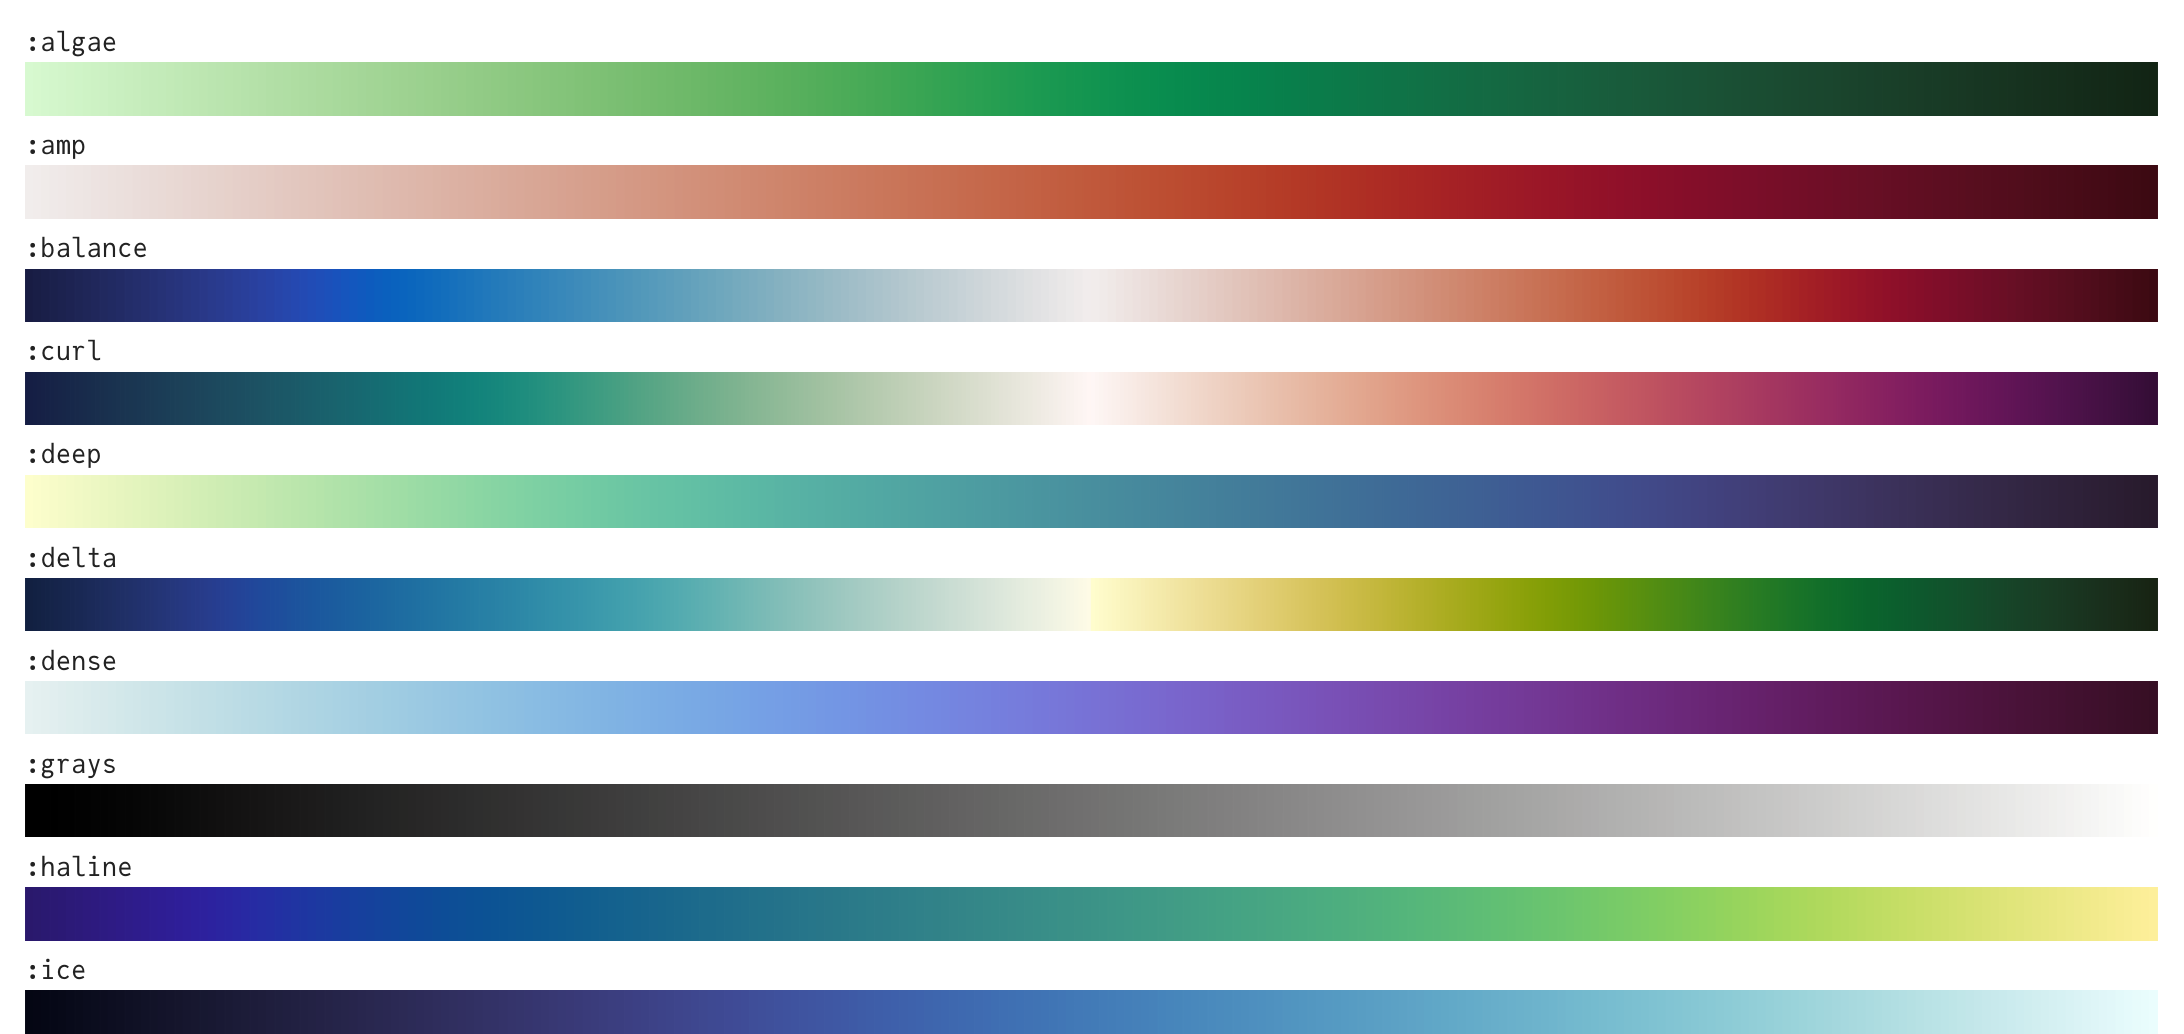
  • Nhiều bảng màu, gồm

Hình xem trước các bảng màu Julia khác nhau.

1 https://juliagraphics.github.io/ColorSchemes.jl/stable/catalogue/
Nhập môn Trực quan hóa Dữ liệu với Julia

Dùng bảng màu

# Đặt theme
theme(:bright)


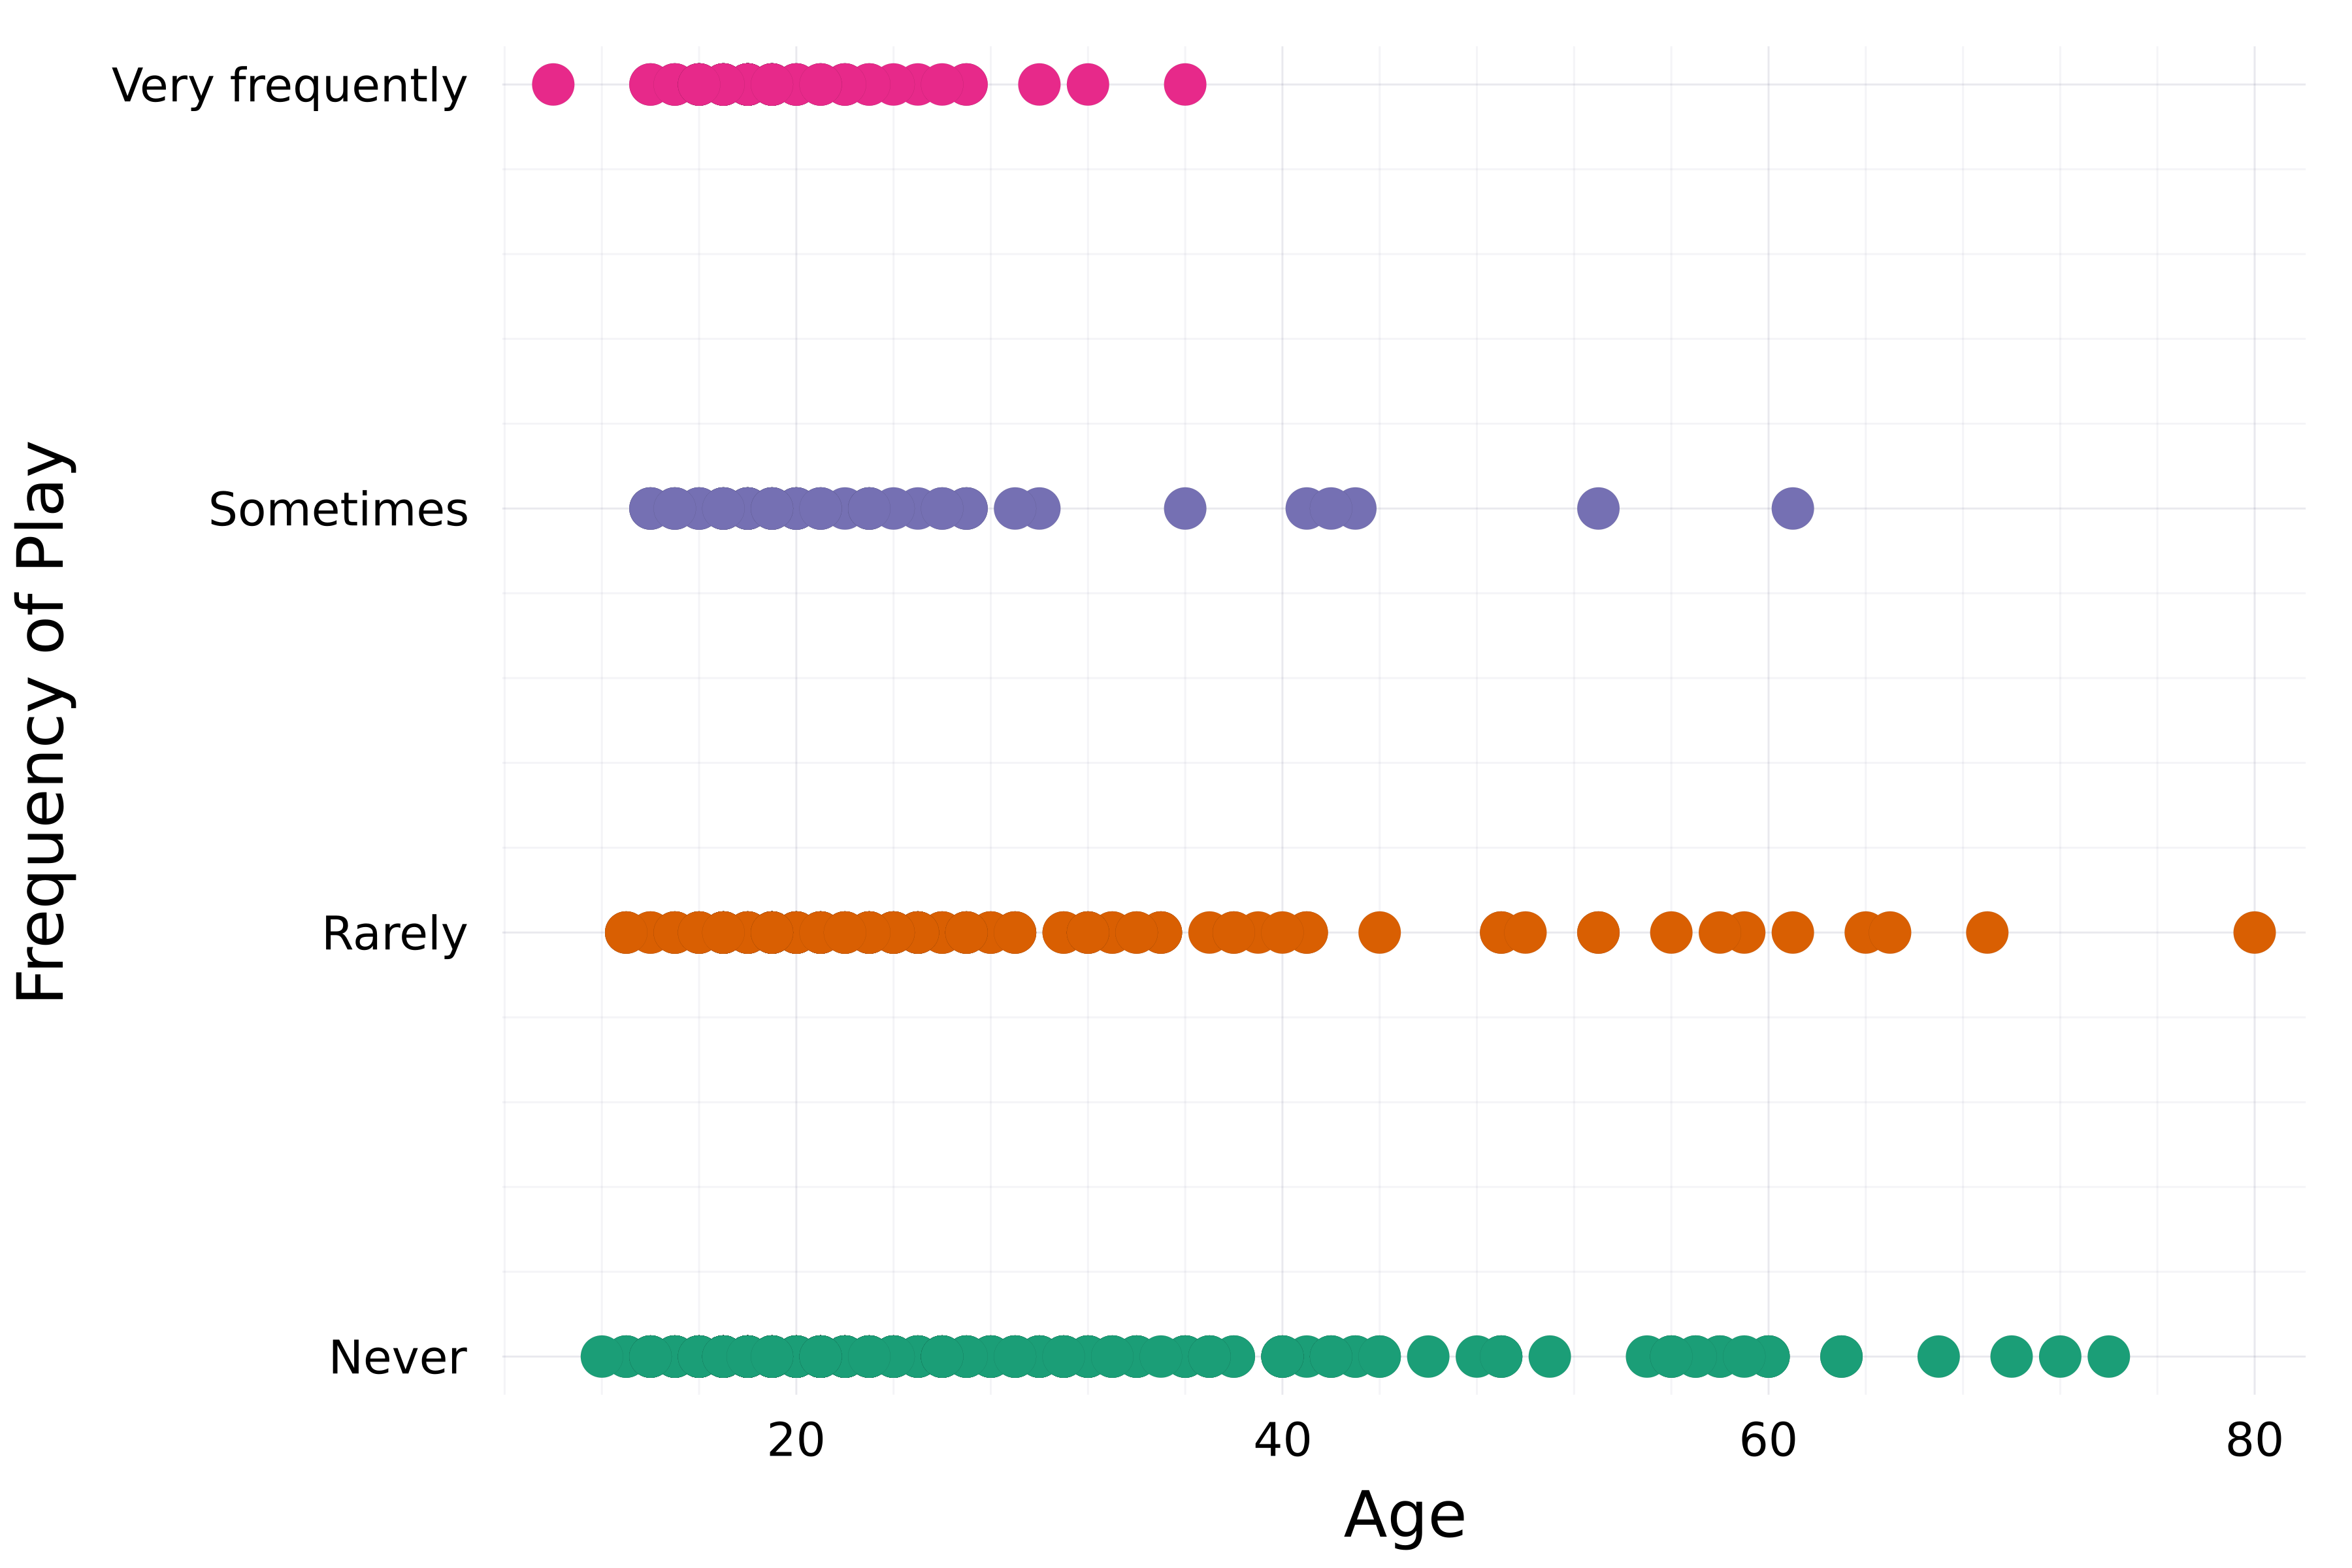
# Tạo biểu đồ scatter scatter( streaming.Age, streaming."Frequency [K pop]", group=streaming."Frequency [K pop]", label=false,
# Đặt bảng màu palette=:Dark2_5 )
xlabel!("Age") ylabel!("Frequency of Play")

Biểu đồ scatter thể hiện tần suất nghe K-Pop theo độ tuổi.

Nhập môn Trực quan hóa Dữ liệu với Julia

Thuộc tính biểu đồ

Đã gặp trước đây:

  • title, xlabel, ylabel
  • xticks, yticks
  • color
  • linecolor, linewidth
  • markercolor
  • framestyle

Còn nhiều nữa:

  • xlims, ylims
  • alpha
  • linestyle
  • legend_title, legend_position
  • markersize, markershape

...

1 https://docs.juliaplots.org/stable/attributes/#attributes
Nhập môn Trực quan hóa Dữ liệu với Julia

Thuộc tính marker

theme(:bright)

scatter(
    streaming.Age,
    streaming."Frequency [K pop]",
    group=streaming."Frequency [K pop]",
    label=false,
    palette=:Dark2_5

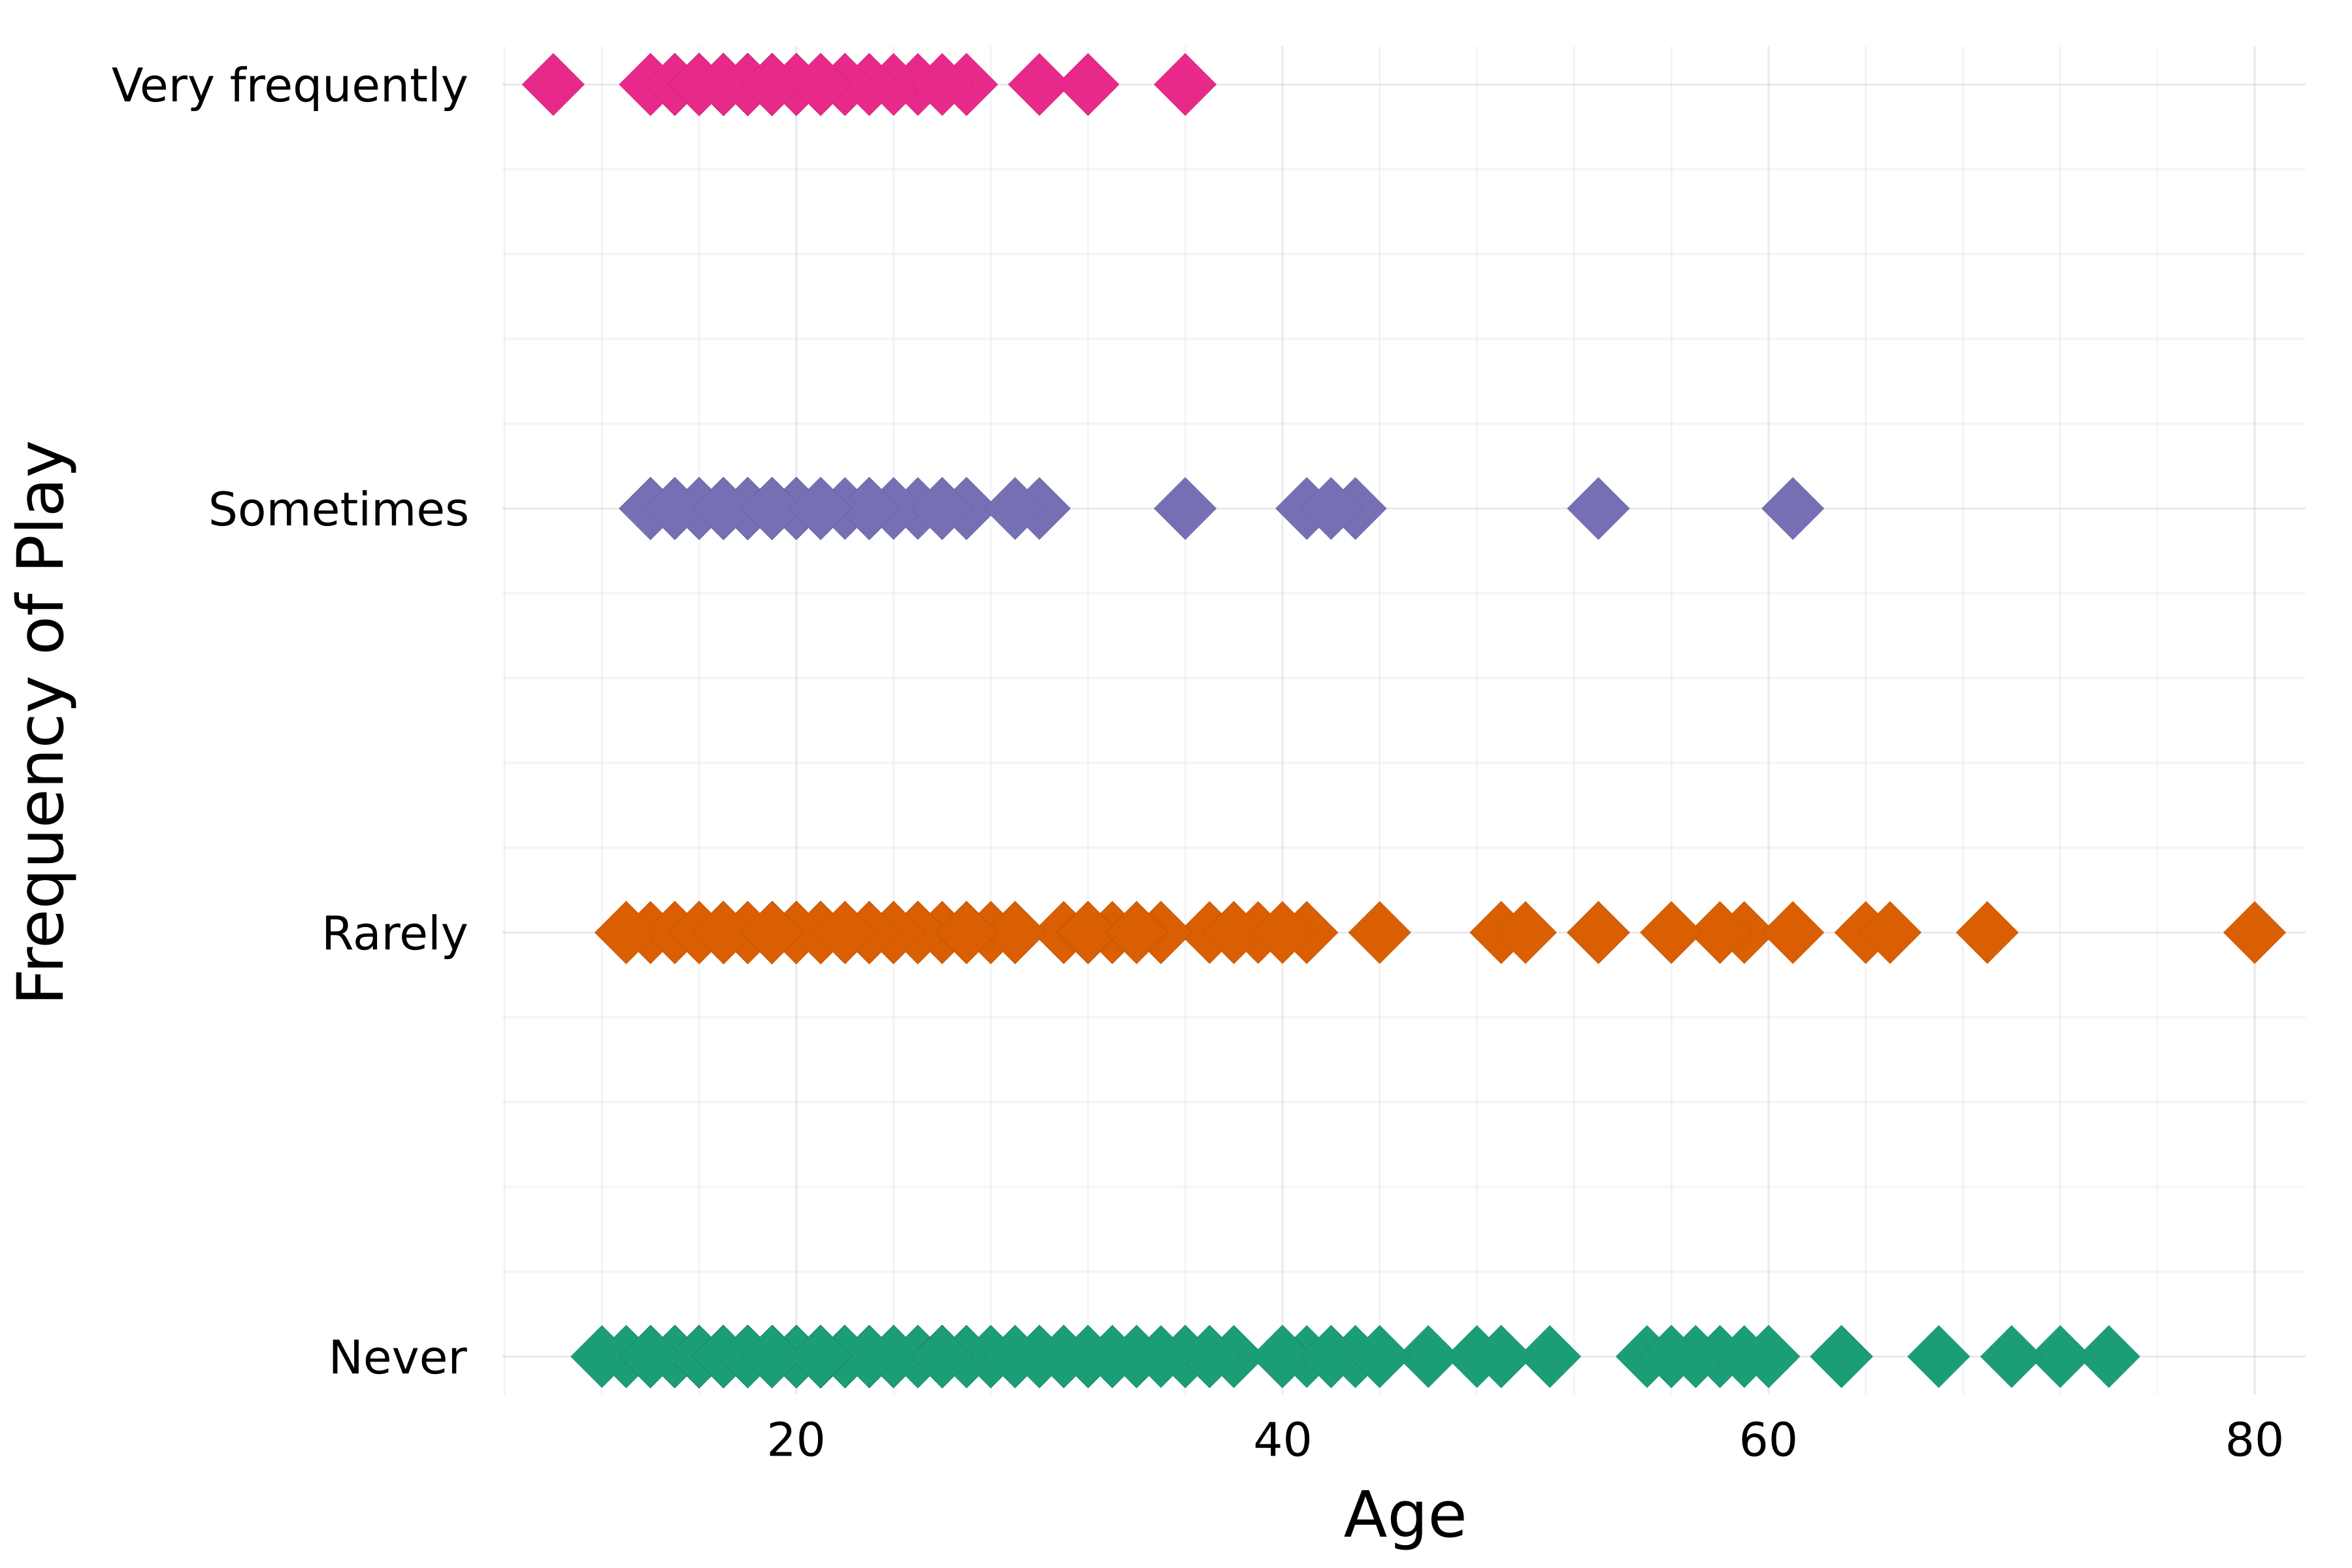
# Thuộc tính marker markershape=:diamond, markersize=8, )
xlabel!("Age") ylabel!("Frequency of Play")

Biểu đồ scatter thể hiện tần suất nghe K-Pop theo độ tuổi, với marker hình kim cương lớn.

Nhập môn Trực quan hóa Dữ liệu với Julia

Độ trong suốt (Opacity)

theme(:bright)

scatter(
    streaming.Age,
    streaming."Frequency [K pop]",
    group=streaming."Frequency [K pop]",
    label=false,
    palette=:Dark2_5
    markershape=:diamond,
    markersize=8,

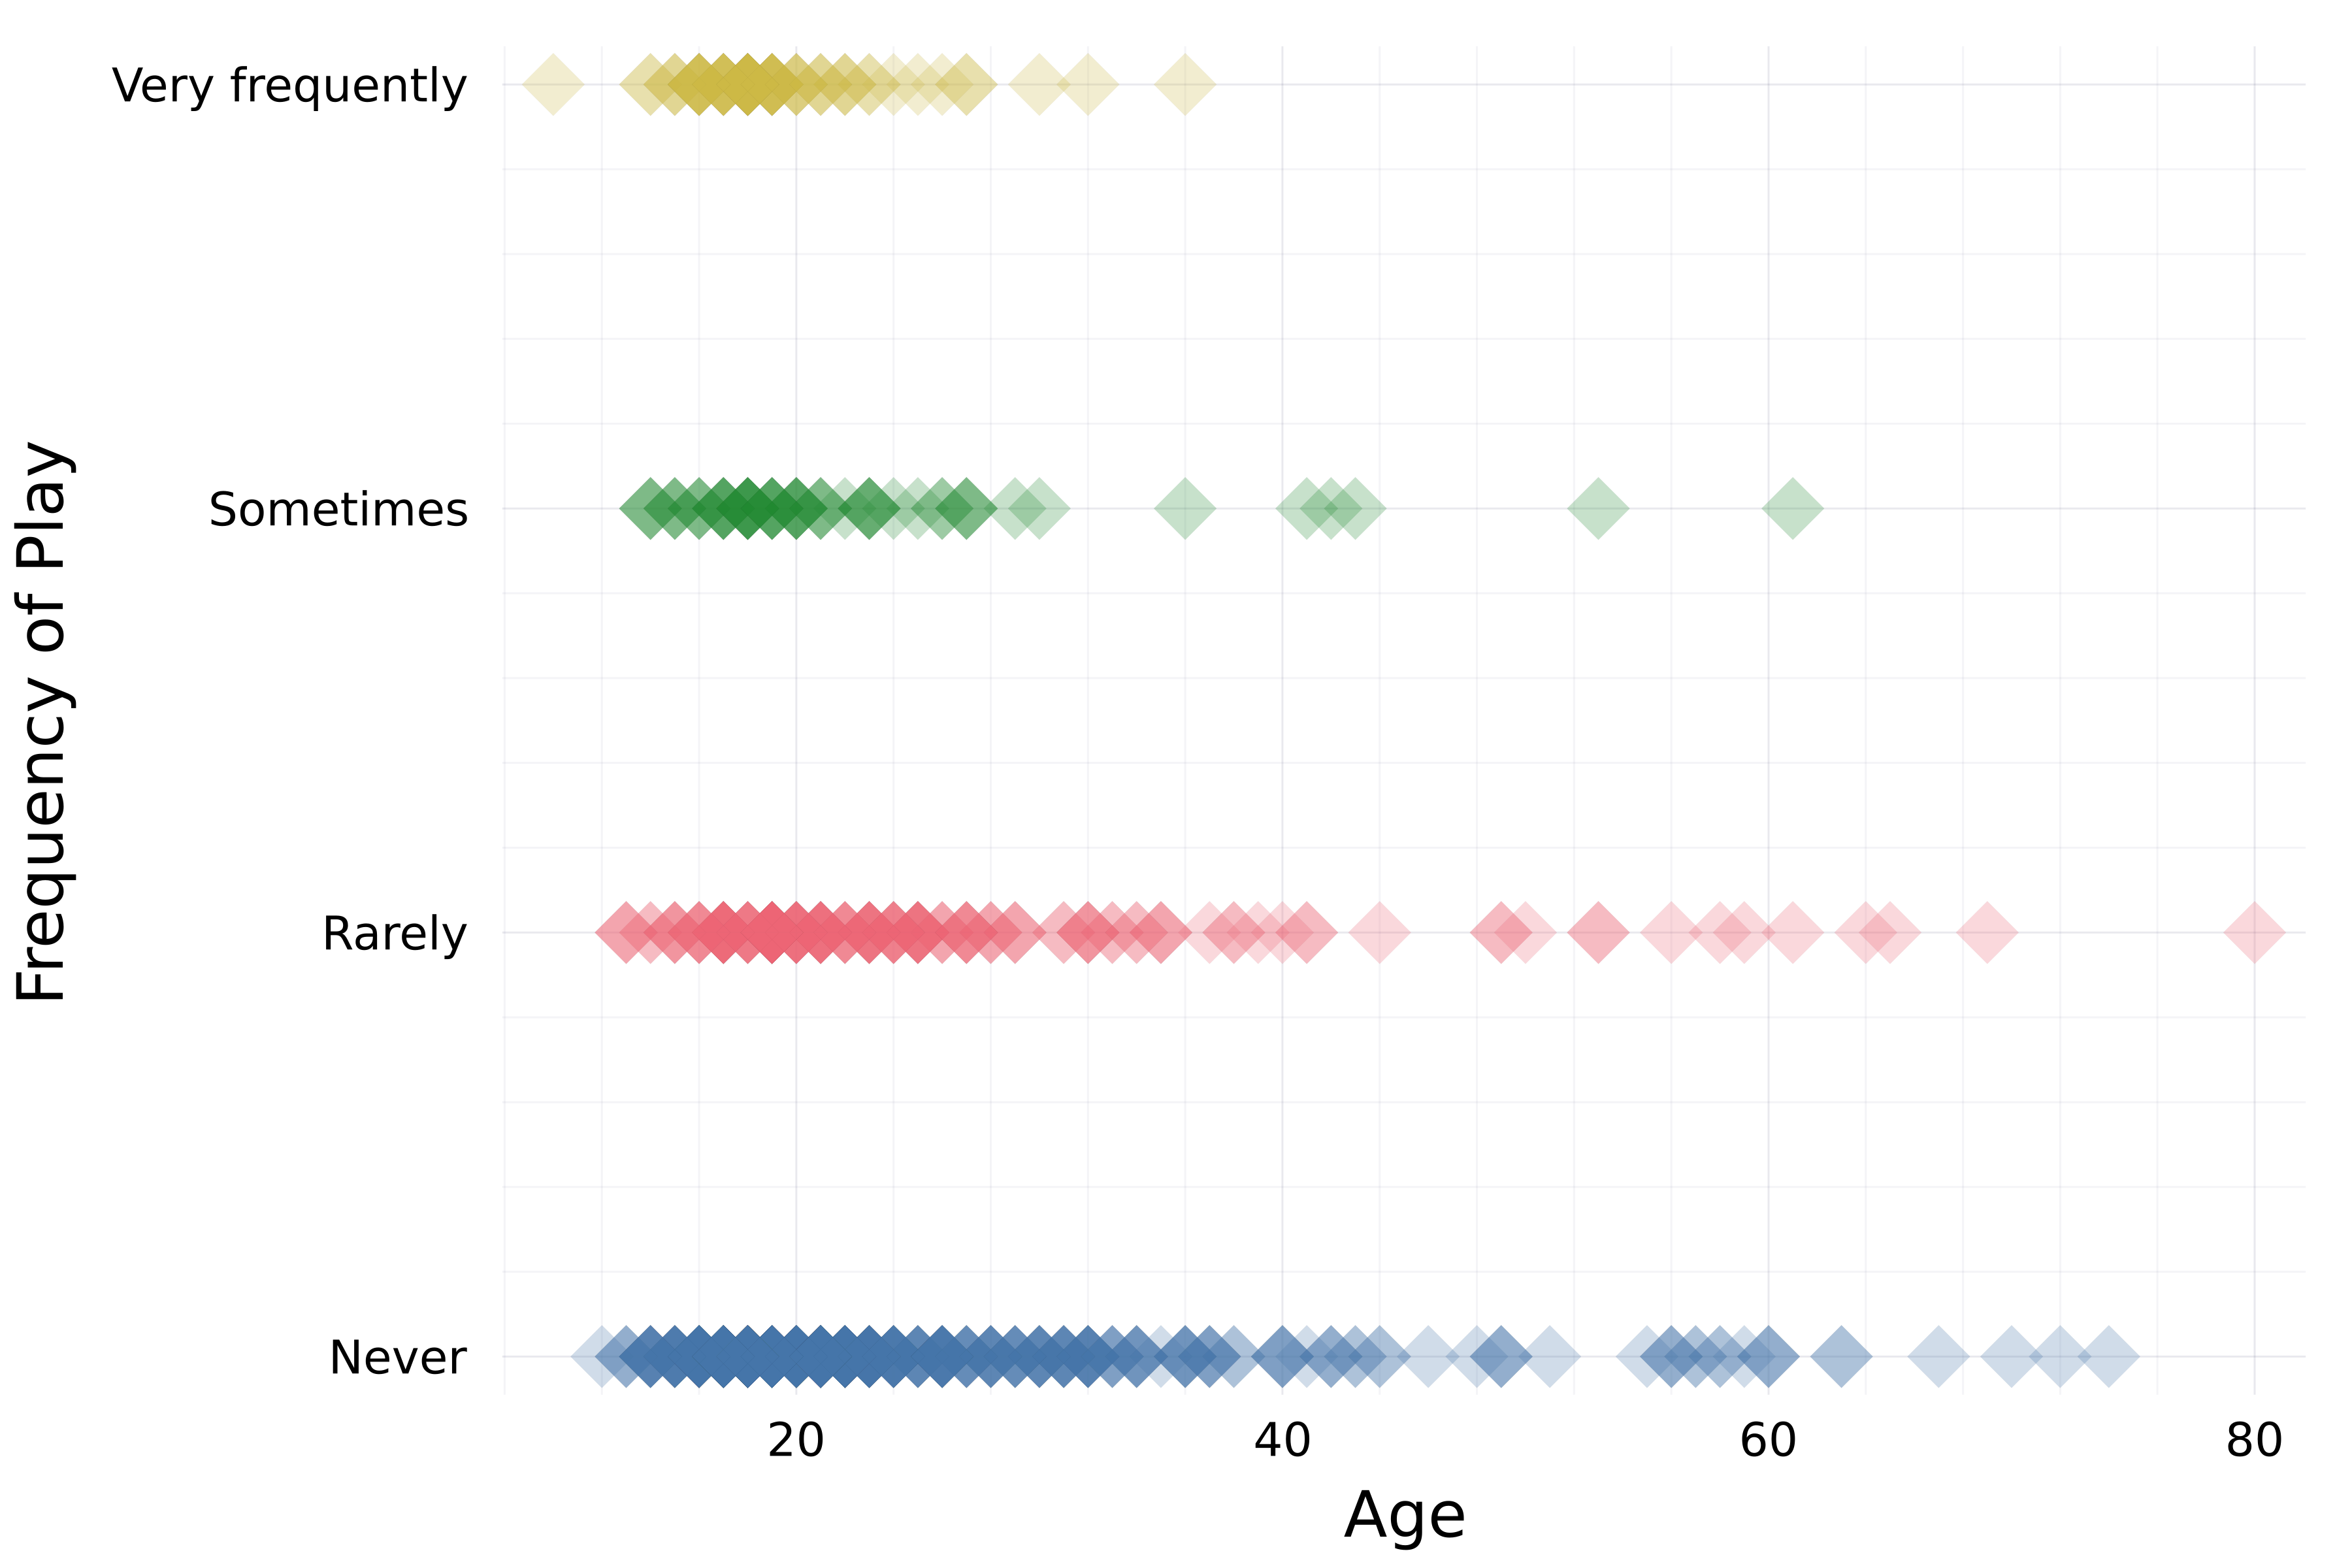
# Độ trong suốt alpha=0.25 )
xlabel!("Age") ylabel!("Frequency of Play")

Biểu đồ scatter thể hiện tần suất nghe K-Pop theo độ tuổi, với marker hình kim cương lớn, có độ trong suốt.

Nhập môn Trực quan hóa Dữ liệu với Julia

Thuộc tính đường nét

# Đặt theme và độ dày nét mặc định
theme(:dao, linewidth=4)

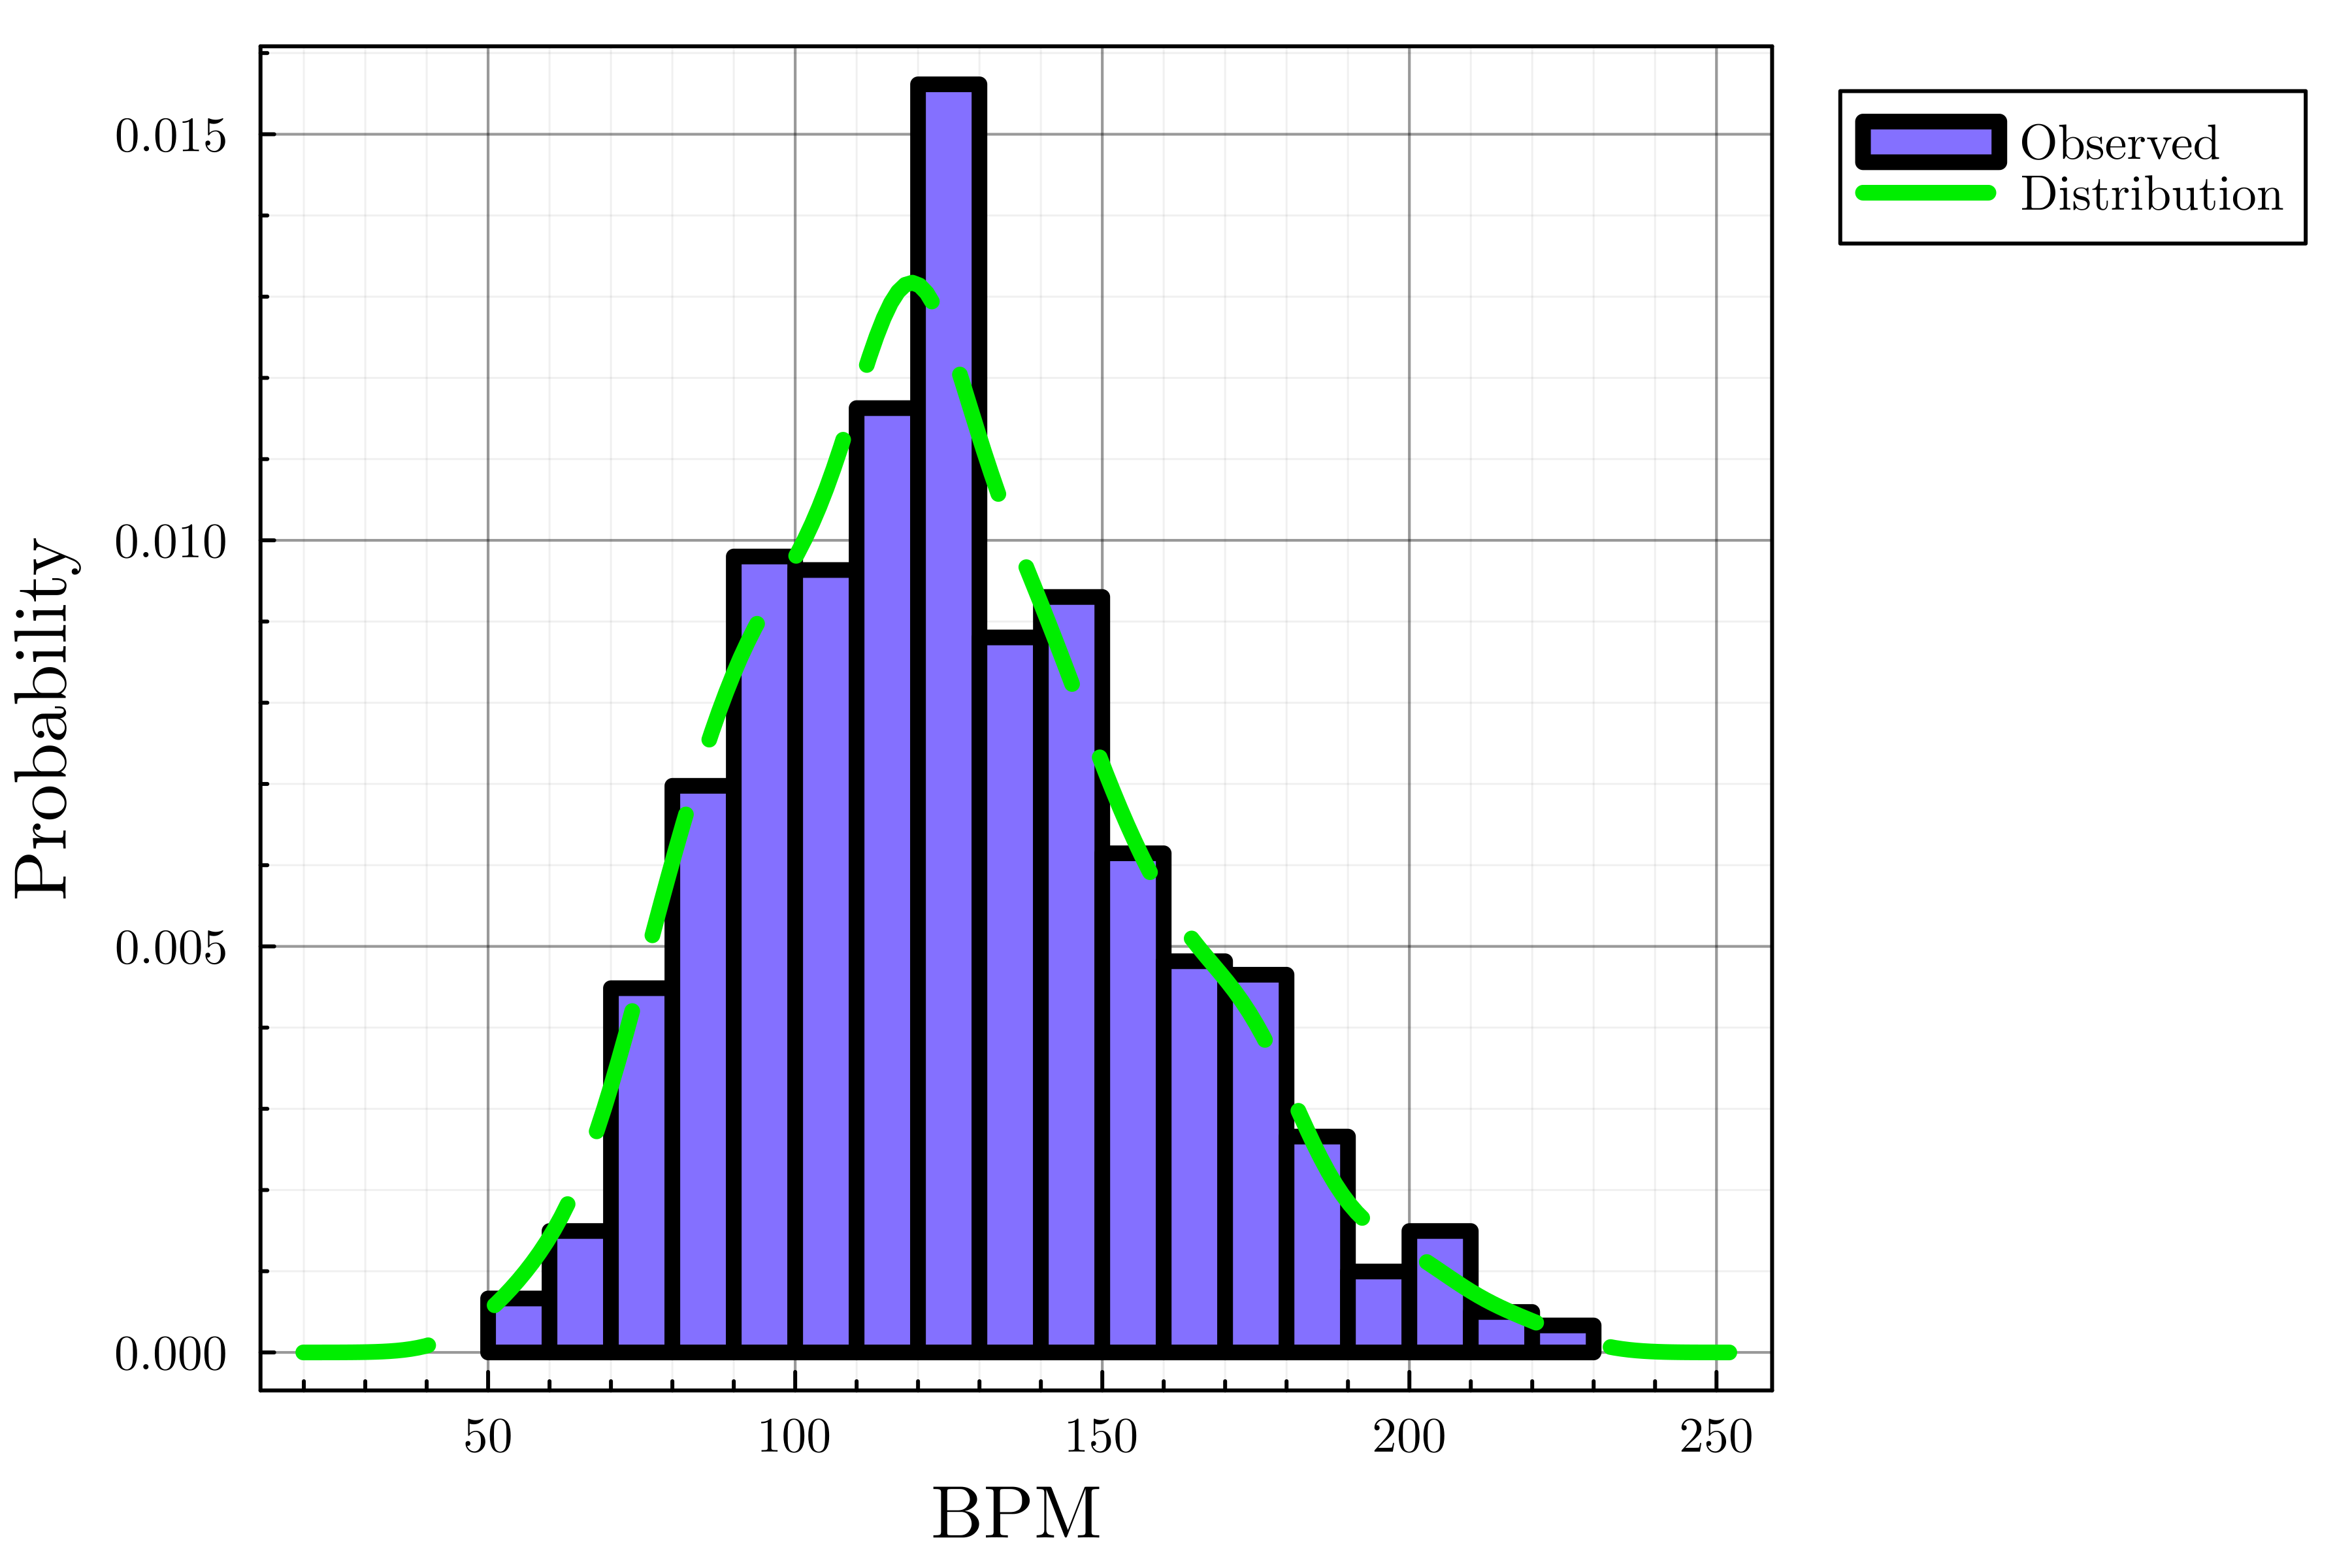
# Tạo biểu đồ histogram histogram(streaming.BPM, label="Observed", color=:lightslateblue, normalize=true)
# Thêm đường mật độ density!(streaming.BPM, label="Distribution", linecolor=:green2,
# Kiểu nét linestyle=:dash)
xlabel!("BPM") ylabel!("Probability")

Histogram đã chuẩn hóa về BPM ưa thích của người tham gia, kèm đường mật độ biểu diễn phân phối ước tính.

Nhập môn Trực quan hóa Dữ liệu với Julia

Giới hạn trục và thuộc tính chú giải

theme(:dao, linewidth=4)

histogram(streaming.BPM, label="Observed", 
    color=:lightslateblue, normalize=true)
density!(streaming.BPM, label="Distribution",
    linecolor=:green2, linestyle=:dash

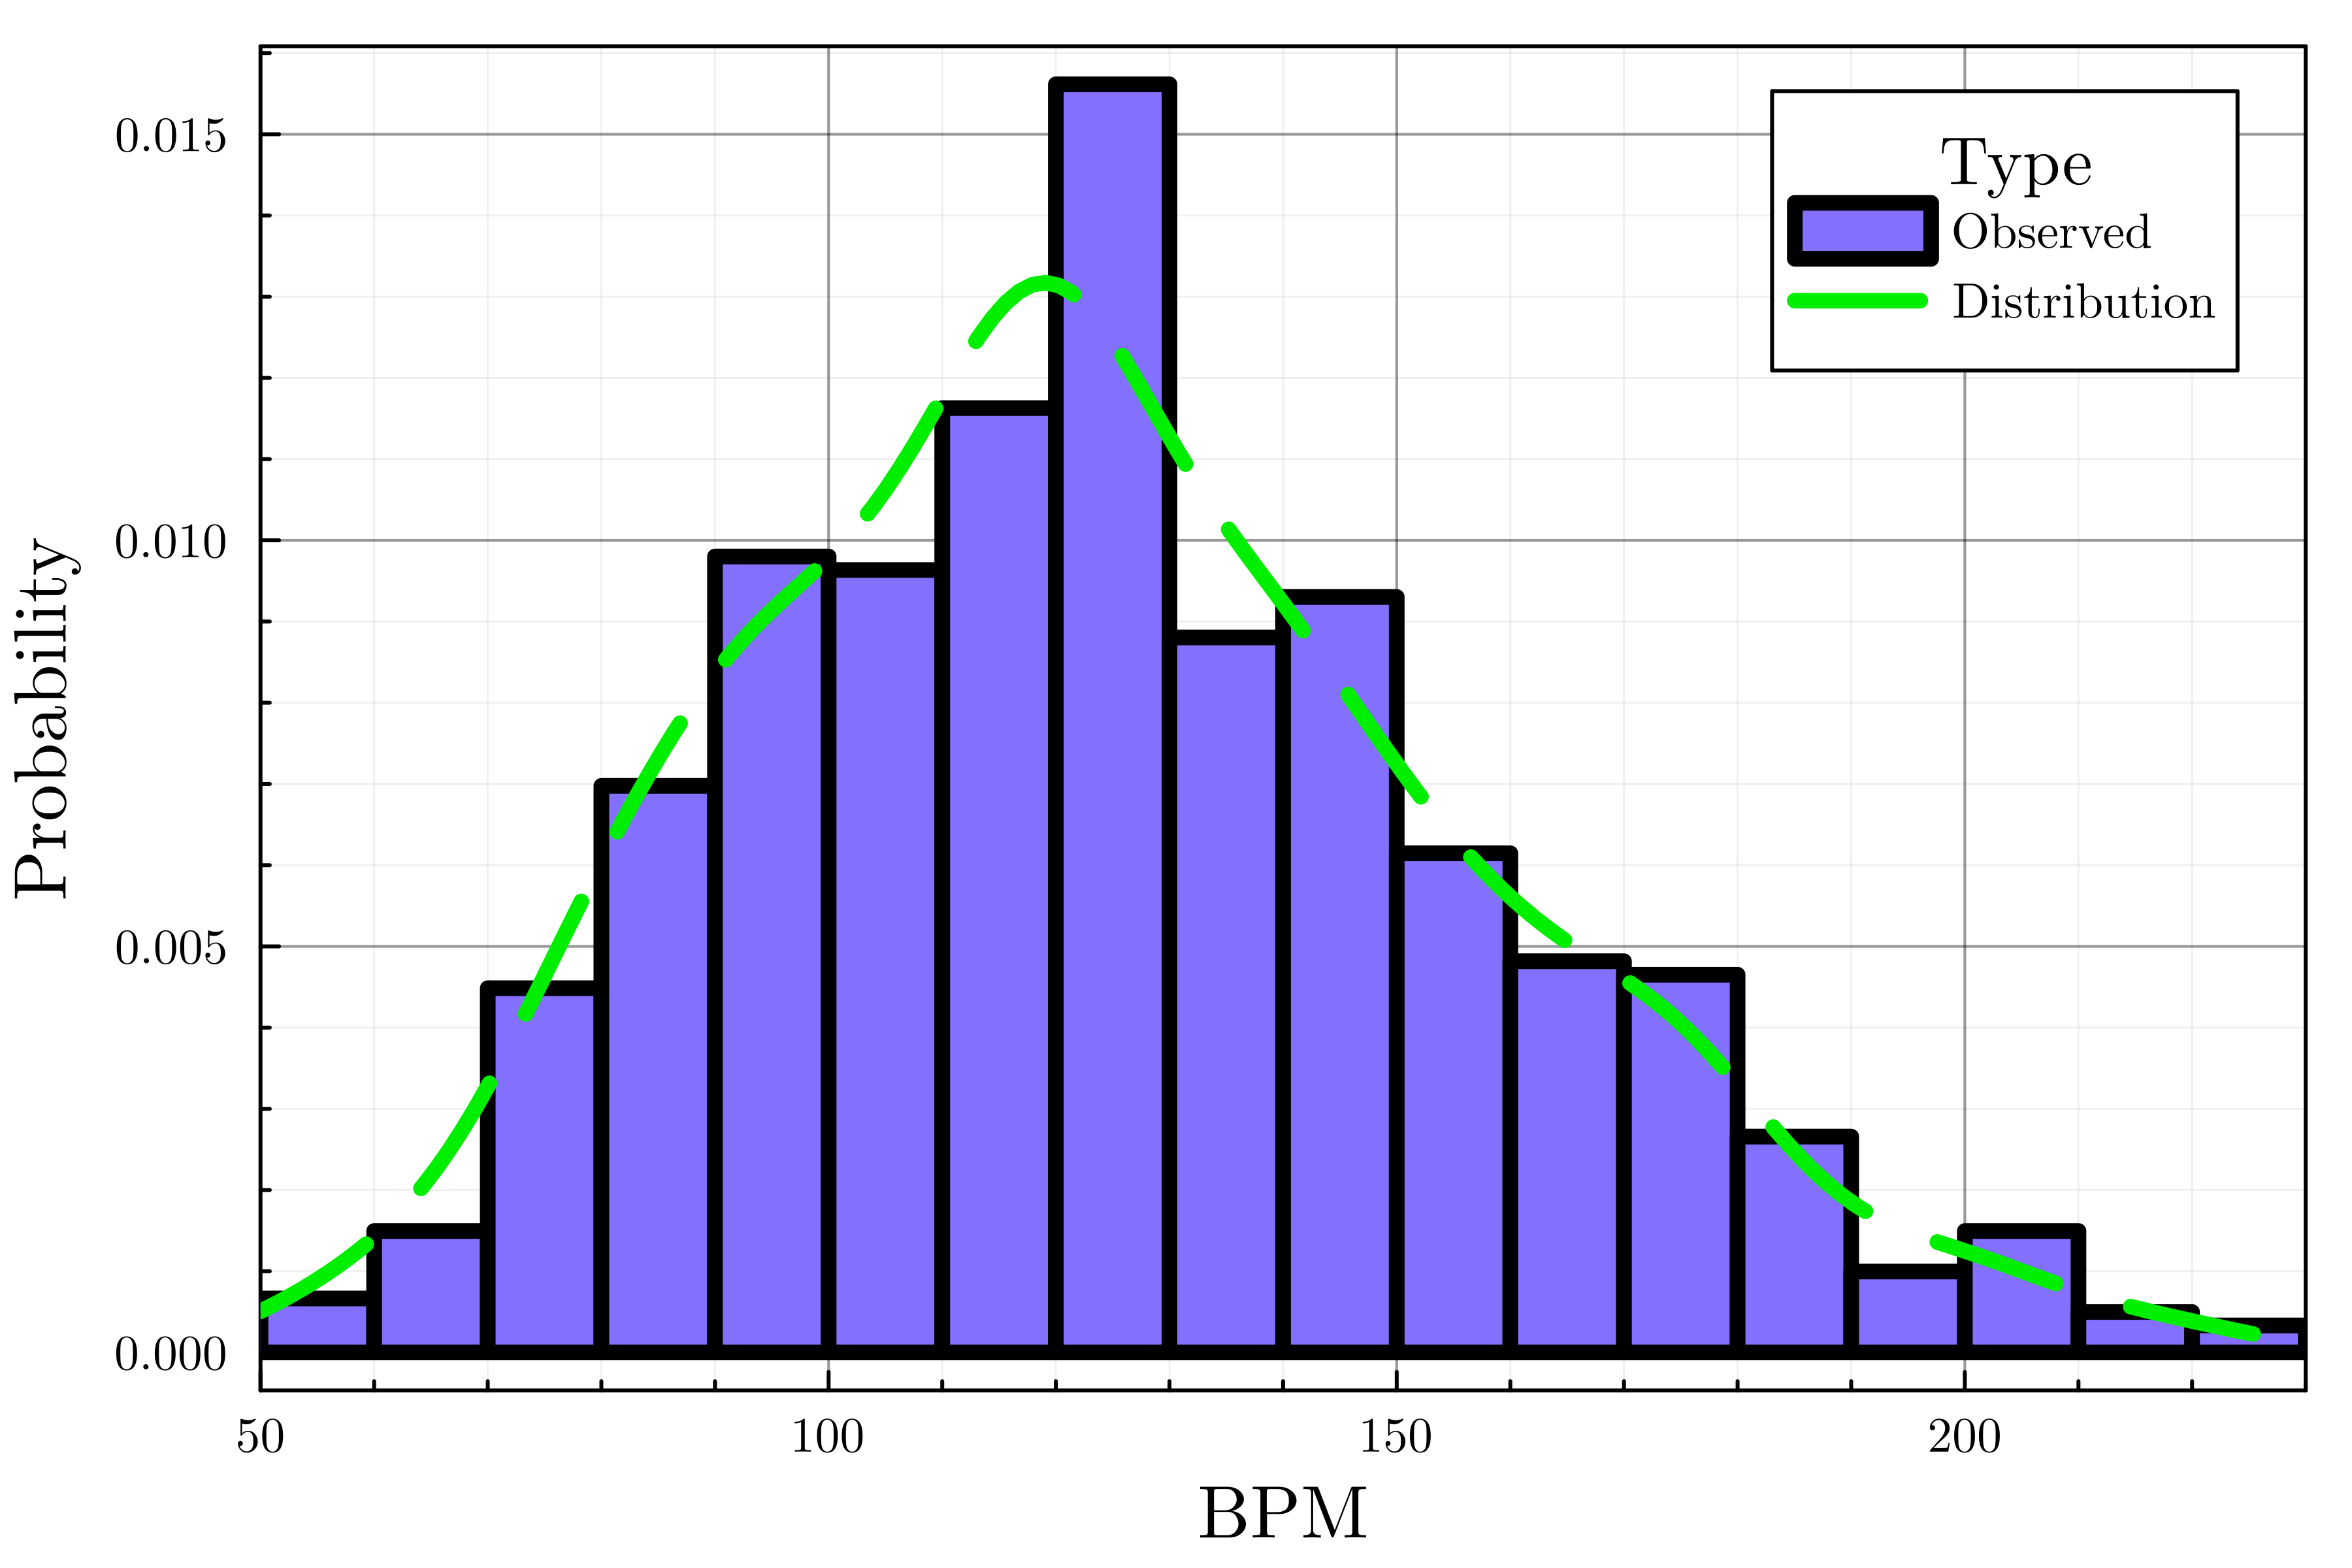
# Tùy chỉnh chú giải legend_title="Type", legend_position=:topright)
# Đặt giới hạn trục x xlims!(50, 230)
xlabel!("BPM") ylabel!("Probability")

Histogram đã chuẩn hóa về BPM ưa thích của người tham gia, kèm đường mật độ biểu diễn phân phối ước tính.

Nhập môn Trực quan hóa Dữ liệu với Julia

Tóm tắt nhanh

  • Bảng màu
    • plot(..., palette=palette_symbol)
  • Thuộc tính marker
    • markersize
    • markershape

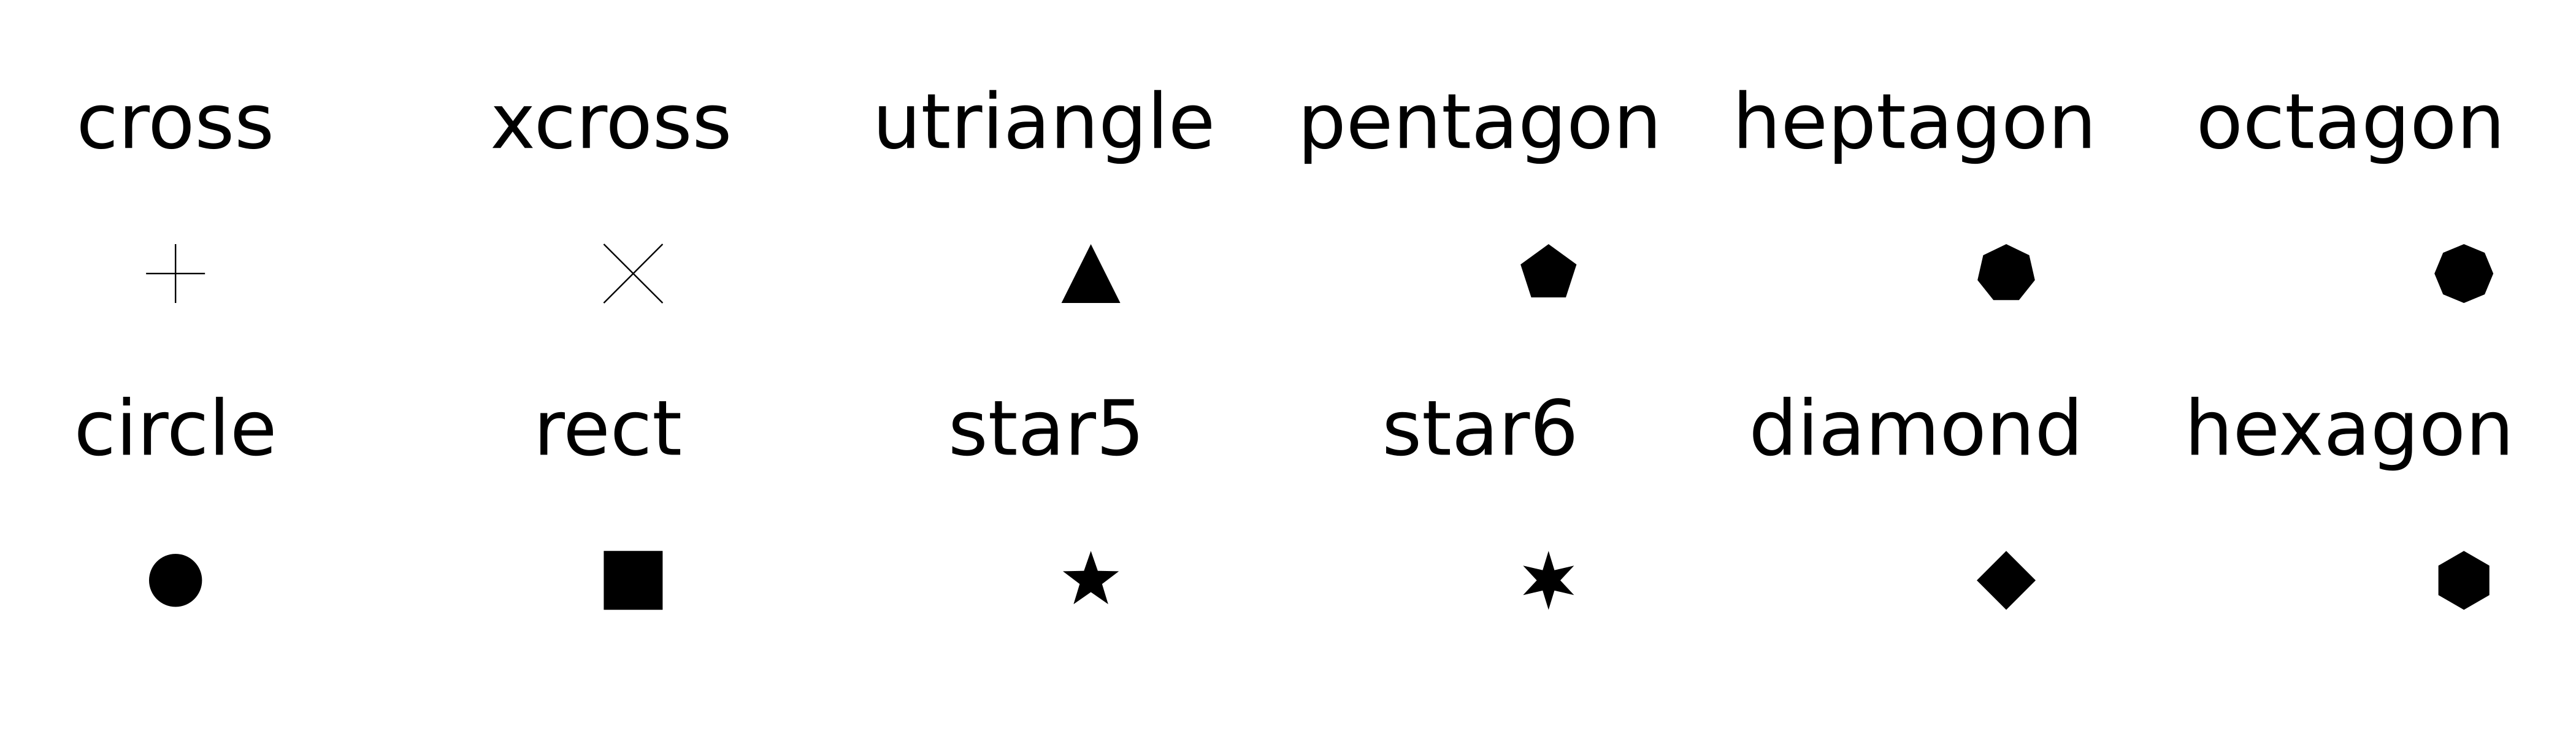
Hình xem trước các dạng marker trong Plots.jl.

  • Độ trong suốt: alpha=opacity_value
  • Giới hạn trục: xlims!(), ylims!()
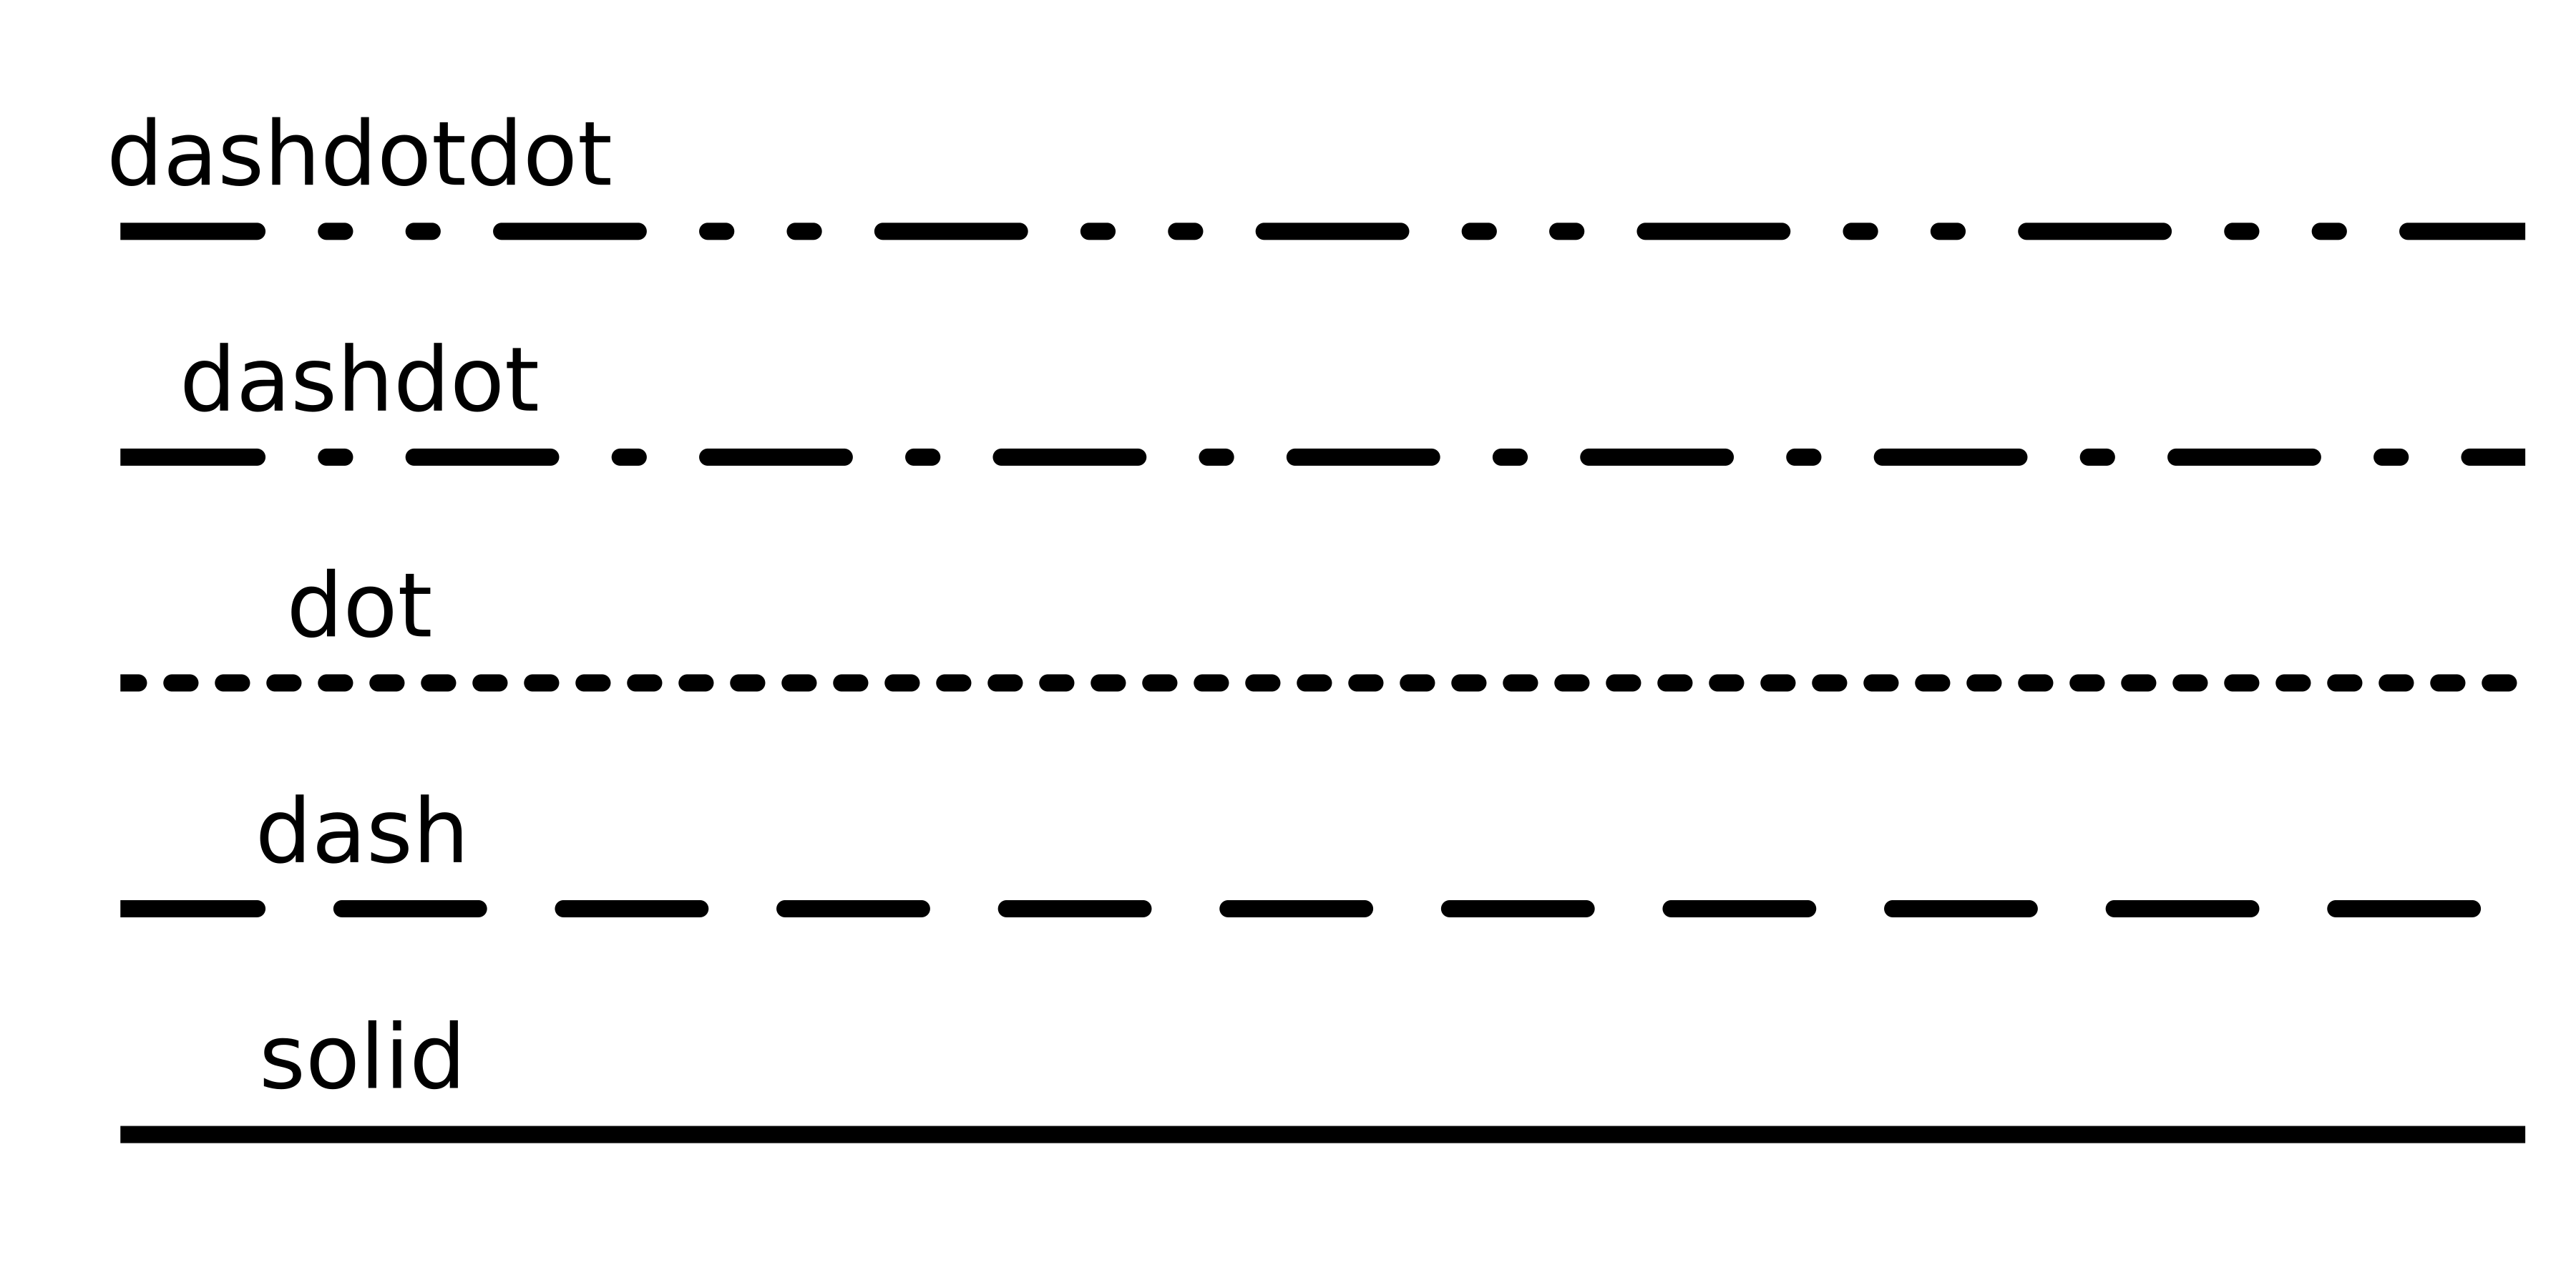
  • Thuộc tính đường: linetyle Hình xem trước các kiểu nét trong Plots.jl.

  • Thuộc tính chú giải

    • legend_title
    • legend_position (:right, :left, :top, :bottom, :topright, :topleft, ...)
Nhập môn Trực quan hóa Dữ liệu với Julia

Ayo berlatih!

Nhập môn Trực quan hóa Dữ liệu với Julia

Preparing Video For Download...