DataFrame linh hoạt, hiệu quả cho dữ liệu dạng bảng
StatsPlots có recipe để vẽ dữ liệu trong DataFrame
Giới thiệu ký hiệu @df!
Trích xuất mảng từ DataFrame
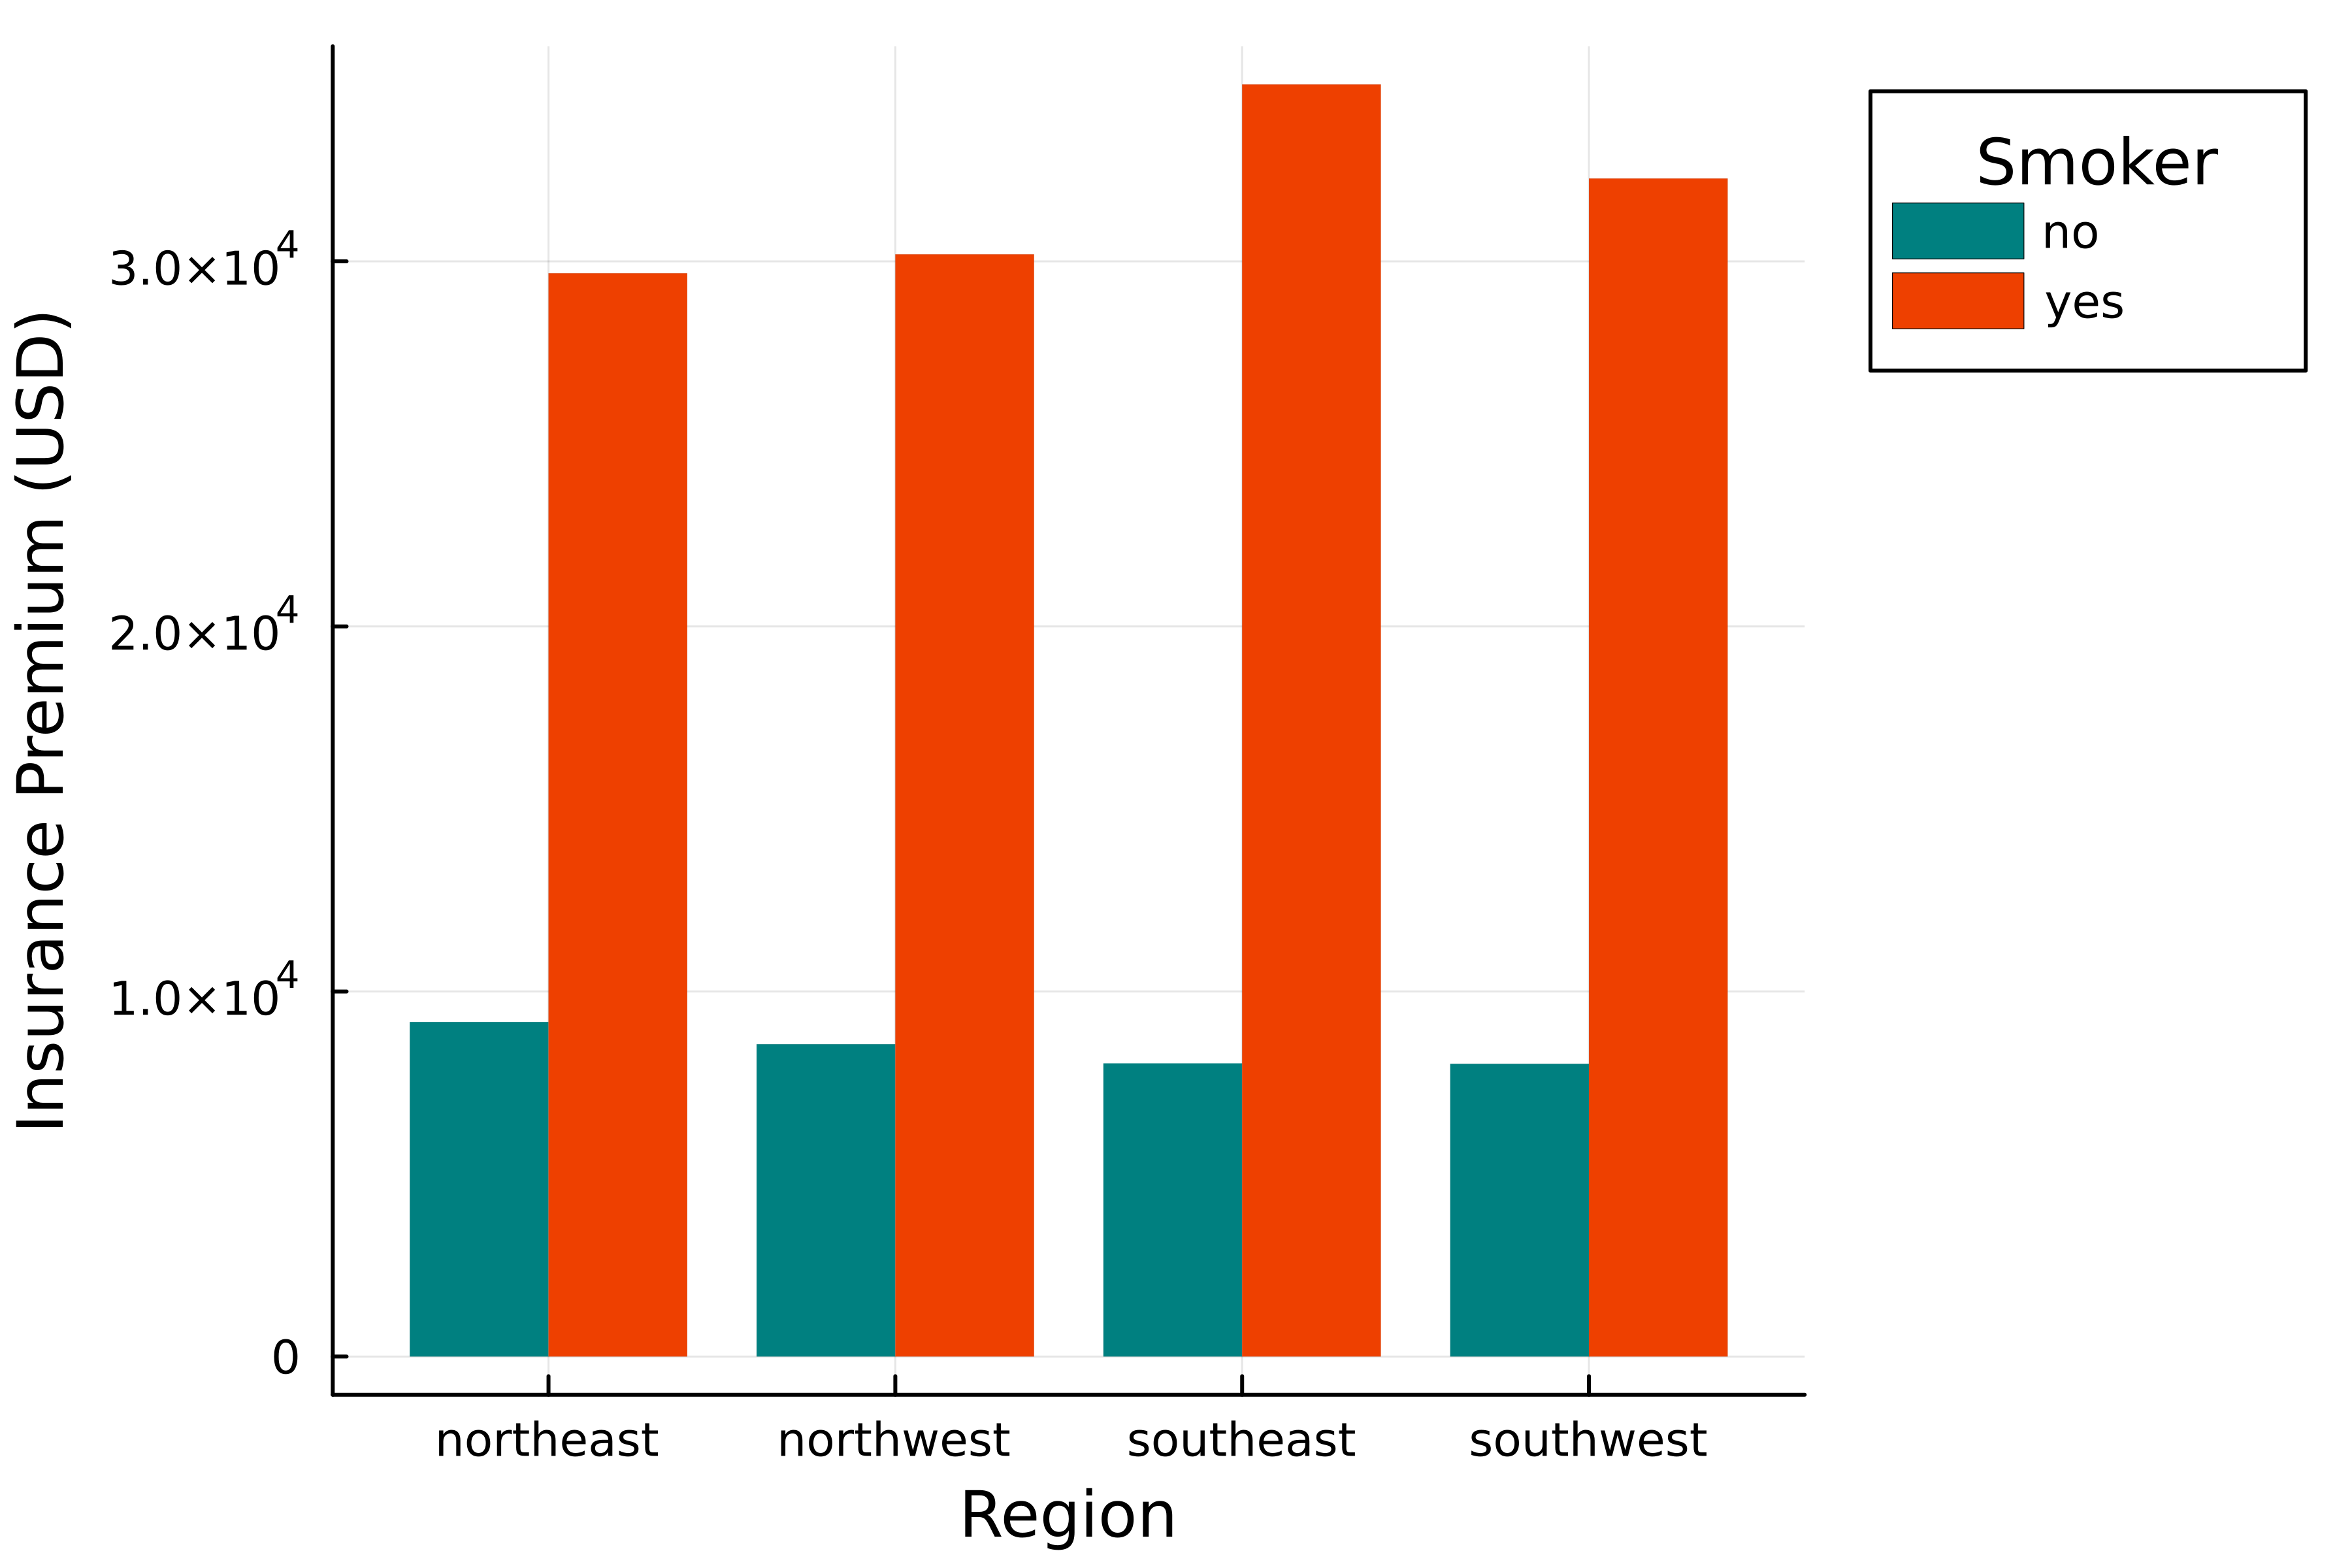
Phí trung bình theo vùng và trạng thái hút thuốc
# Nhóm theo vùng và hút thuốc
grouped = groupby(insurance, [:Region, :Smoker])

# Tính phí trung bình
grouped_mean_charges = combine(grouped, :Charges => mean)
Mỗi cột là một mảng dữ liệu
Ví dụ, grouped_mean_charges.Region trả về mảng chuỗi tên vùng.
Vẽ dữ liệu từ mảng
# Biểu đồ cột nhóm
groupedbar(

    # Truyền mảng làm đối số
    grouped_mean_charges.Region,
    grouped_mean_charges.Charges_mean,
    group=grouped_mean_charges.Smoker,

    color=[:teal :orangered2],
    linewidth=0,
    legend_title="Smoker",
    legend_position=:outertopright)
xlabel!("Region")
ylabel!("Insurance Premium (USD)")
Vẽ trực tiếp từ DataFrame
# Vẽ từ DataFrame
@df grouped_mean_charges groupedbar(

    # Truyền tên cột
    :Region,
    :Charges_mean,

    group=:Smoker,

    color=[:teal :orangered2],
    linewidth=0,
    legend_title="Smoker",
    legend_position=:outertopright)
xlabel!("Region")
ylabel!("Insurance Premium (USD)")
So sánh cạnh nhau
# Biểu đồ cột nhóm
groupedbar(

    # Truyền mảng làm đối số
    grouped_mean_charges.Region,
    grouped_mean_charges.Charges_mean,
    group=grouped_mean_charges.Smoker,

    color=[:teal :orangered2],
    linewidth=0,
    legend_title="Smoker",
    legend_position=:outertopright)
xlabel!("Region")
ylabel!("Insurance Premium (USD)")
# Vẽ từ DataFrame
@df grouped_mean_charges groupedbar(

    # Truyền tên cột
    :Region,
    :Charges_mean,
    group=:Smoker,

    color=[:teal :orangered2],
    linewidth=0,
    legend_title="Smoker",
    legend_position=:outertopright)
xlabel!("Region")
ylabel!("Insurance Premium (USD)")
Chaining lệnh DataFrame
Từ trước
# Nhóm theo vùng và hút thuốc
grouped = groupby(insurance, [:Region, :Smoker])
# Tính phí trung bình
grouped_mean_charges = combine(grouped, :Charges => mean)
Dùng chaining thay thế
using Chain
# Chain groupby và combine
grouped_mean_charges = @chain insurance begin
  groupby([:Region, :Smoker])
  combine(:Charges => mean)
end