Nhập môn Trực quan hóa Dữ liệu với Julia
Gustavo Vieira Suñe
Data Analyst

layout)
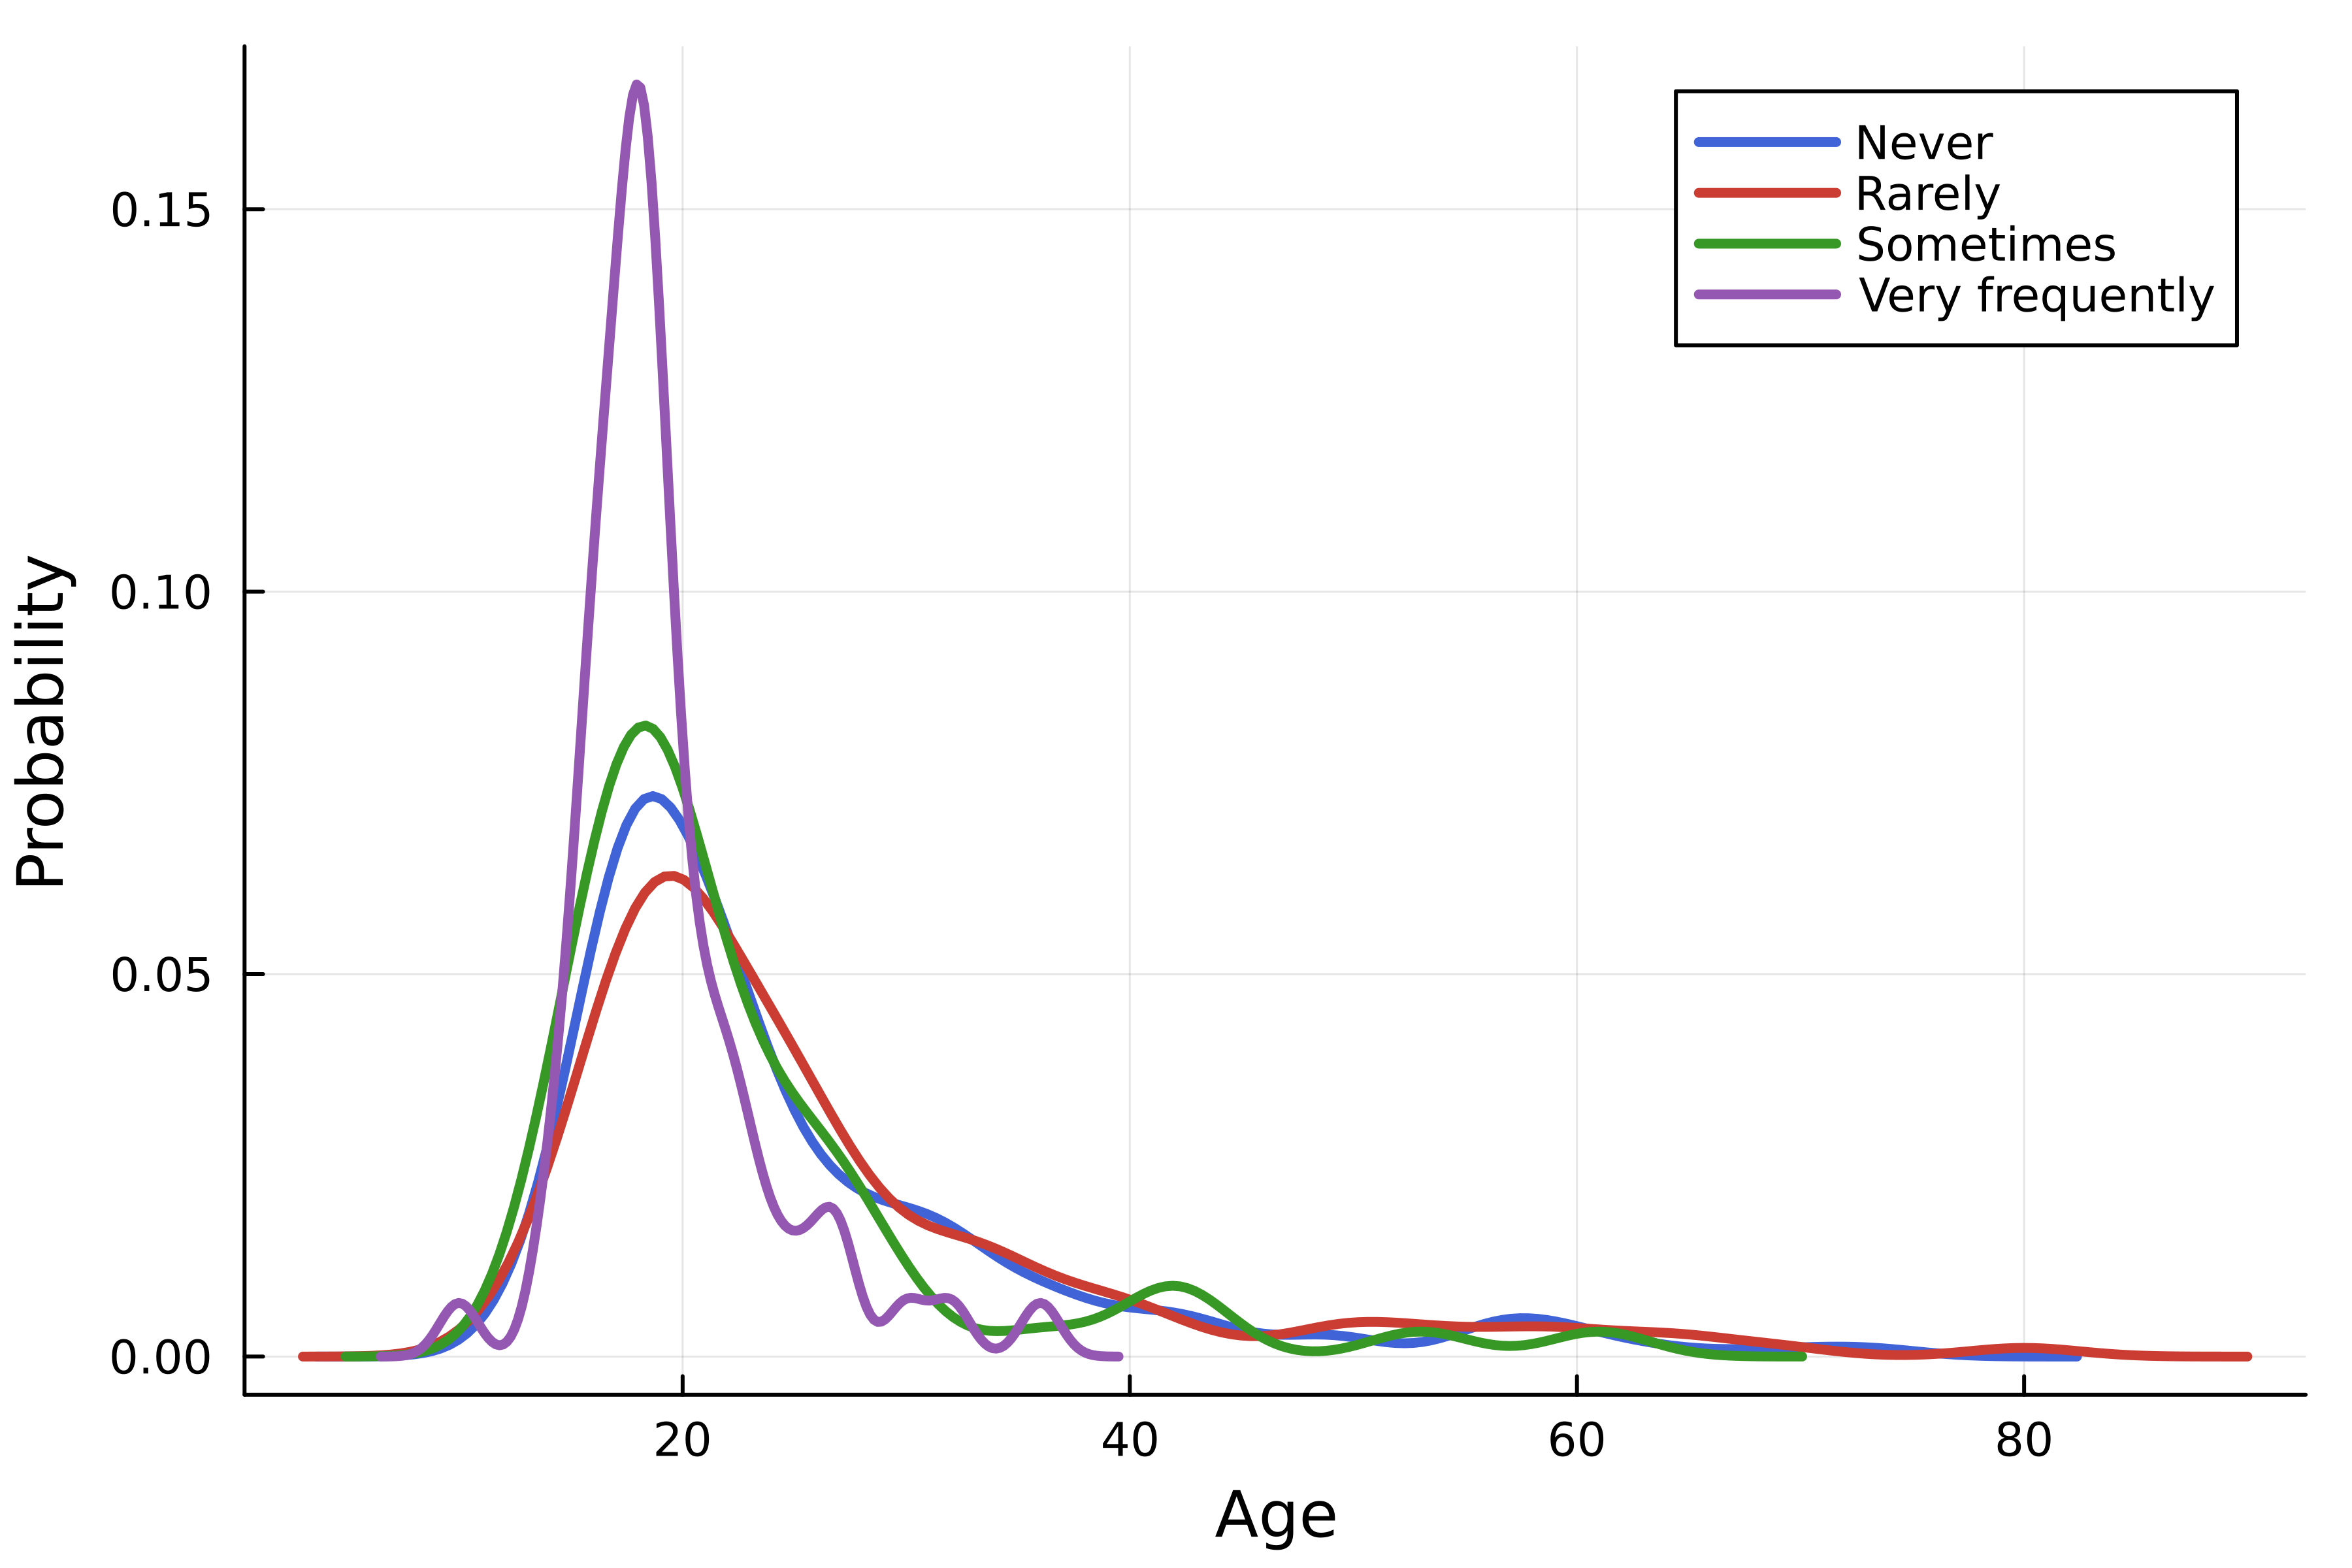
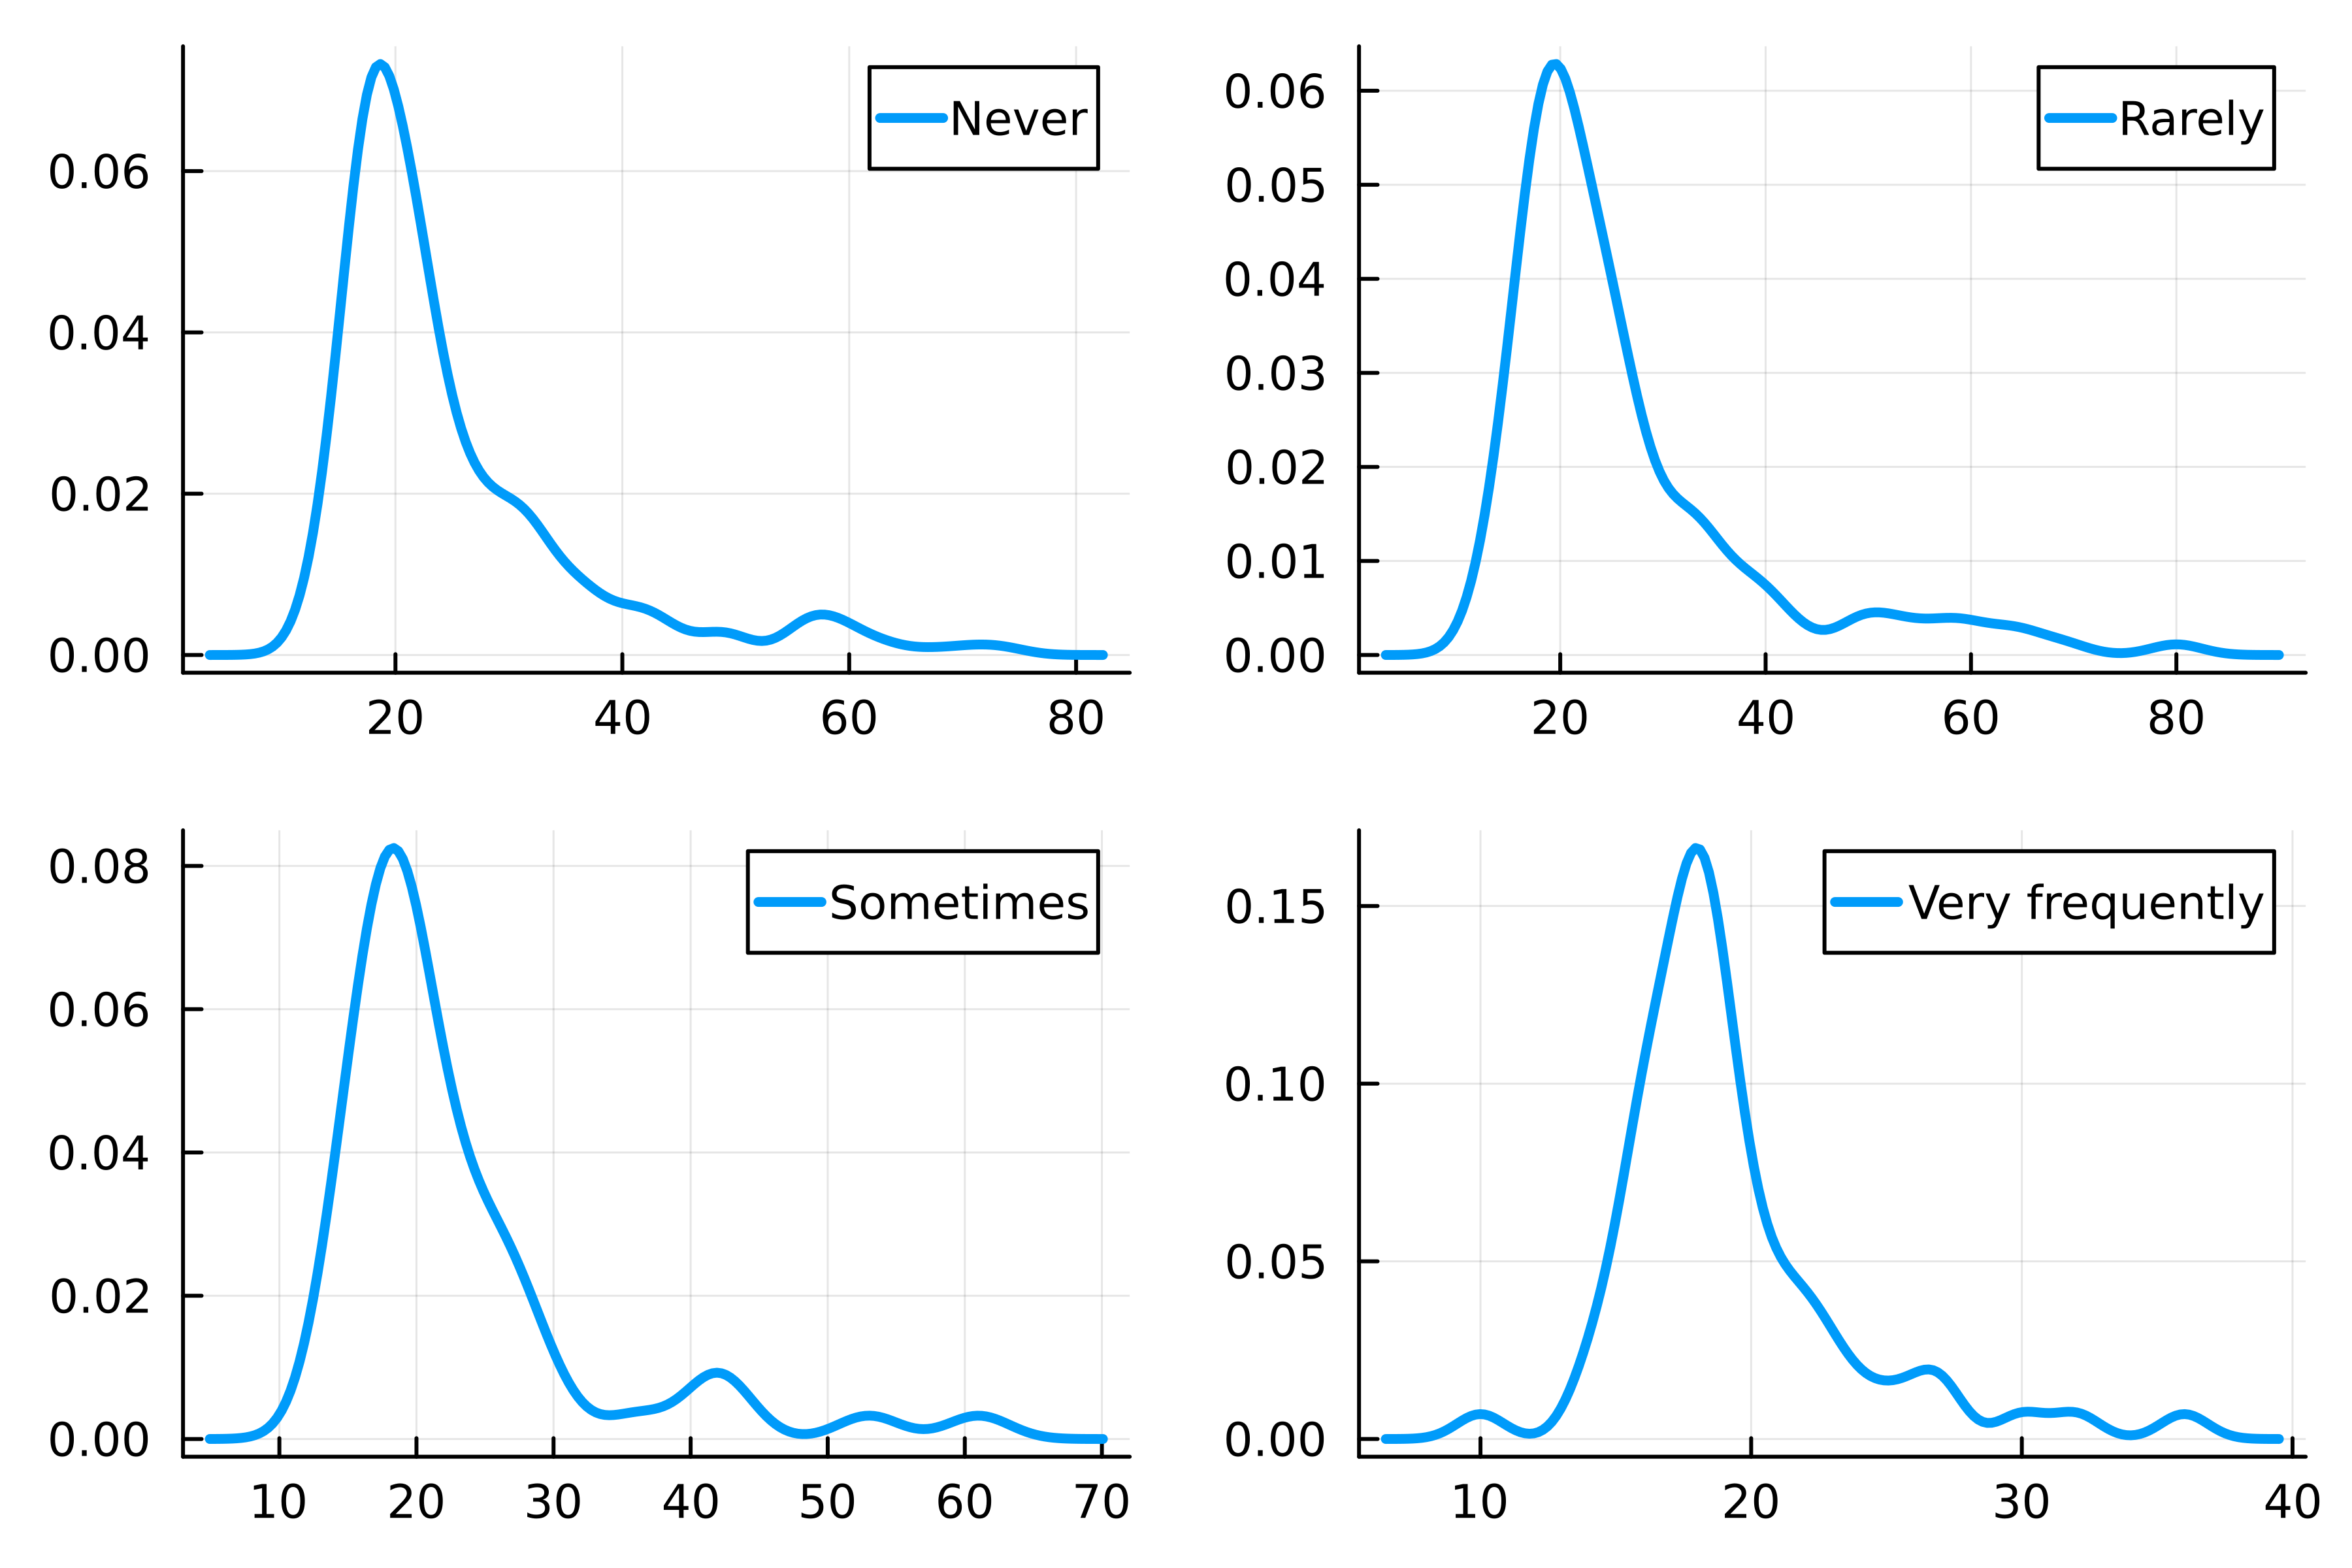
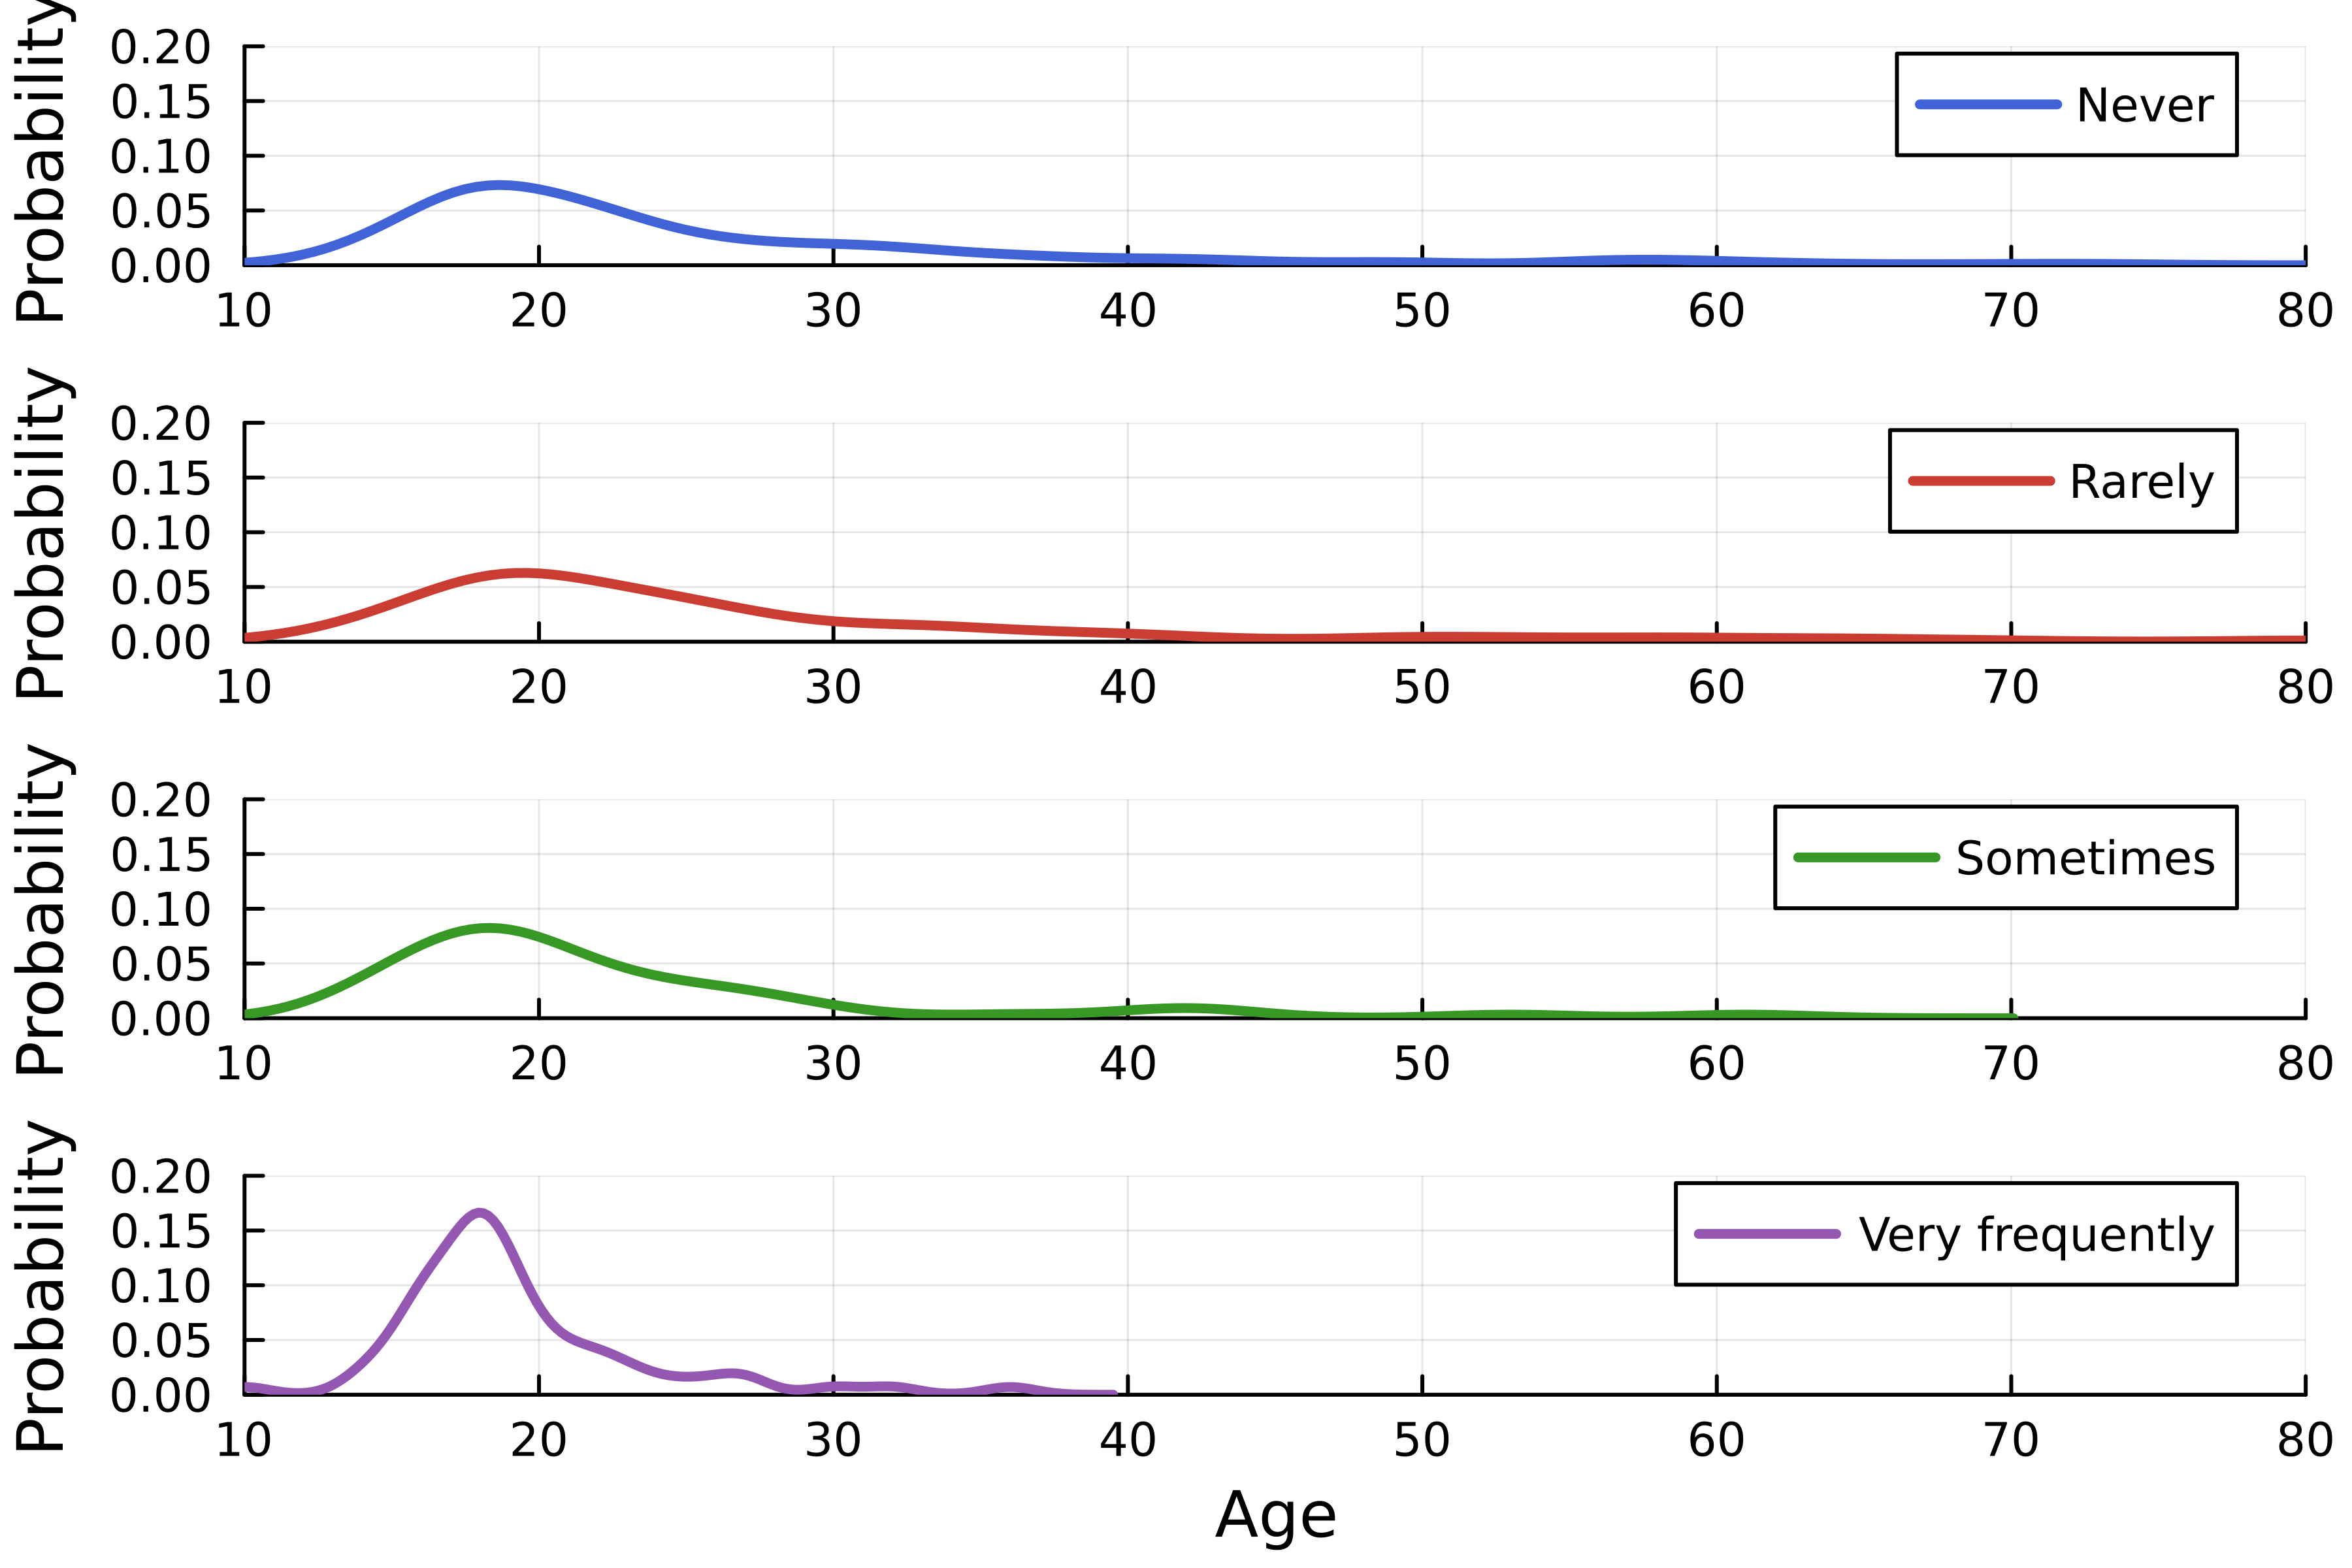
using StatsPlots, DataFrames, CSV # Tải dữ liệu streaming = DataFrame( CSV.File("streaming.csv") )# Tạo biểu đồ mật độ density( streaming.Age, group=streaming."Frequency [K pop]", linewidth=2.5,# Thiết lập bố cục layout=4, )

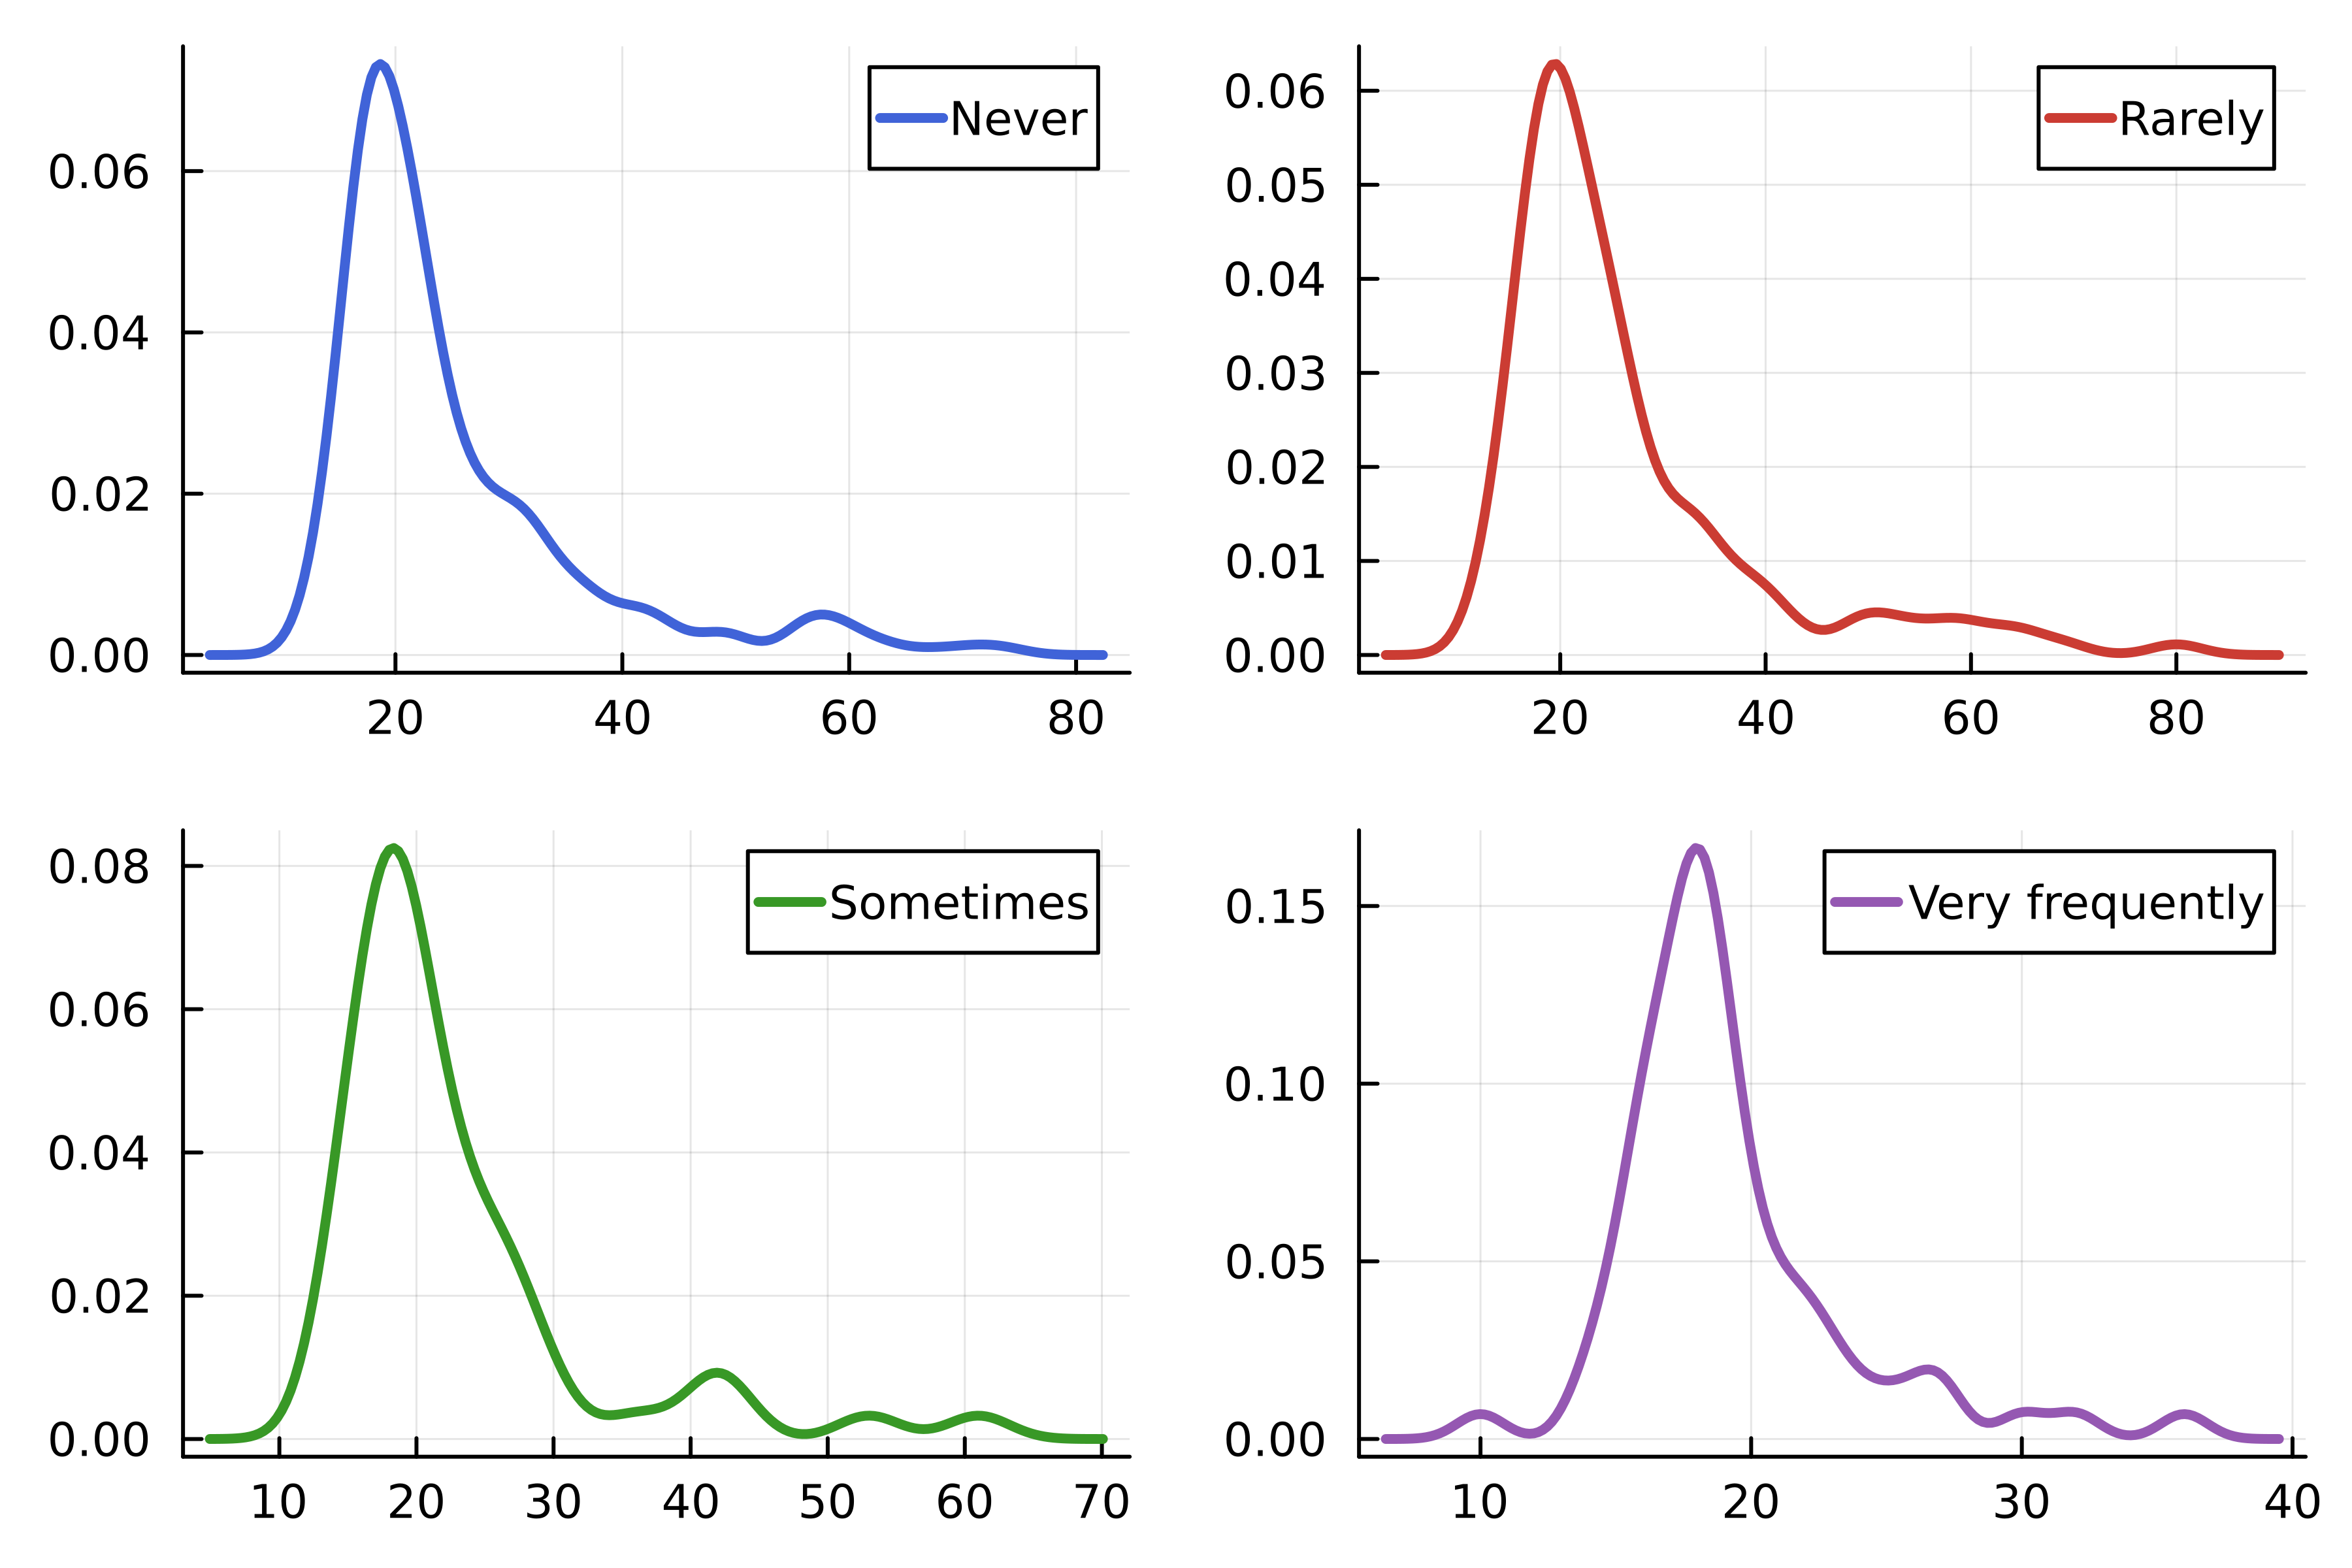
using Colors # Màu logo Julia logocolors = Colors.JULIA_LOGO_COLORS colors = [logocolors.blue logocolors.red logocolors.green logocolors.purple]density( streaming.Age, group=streaming."Frequency [K pop]", linewidth=2.5, layout=4, # Màu đường linecolor=colors, )

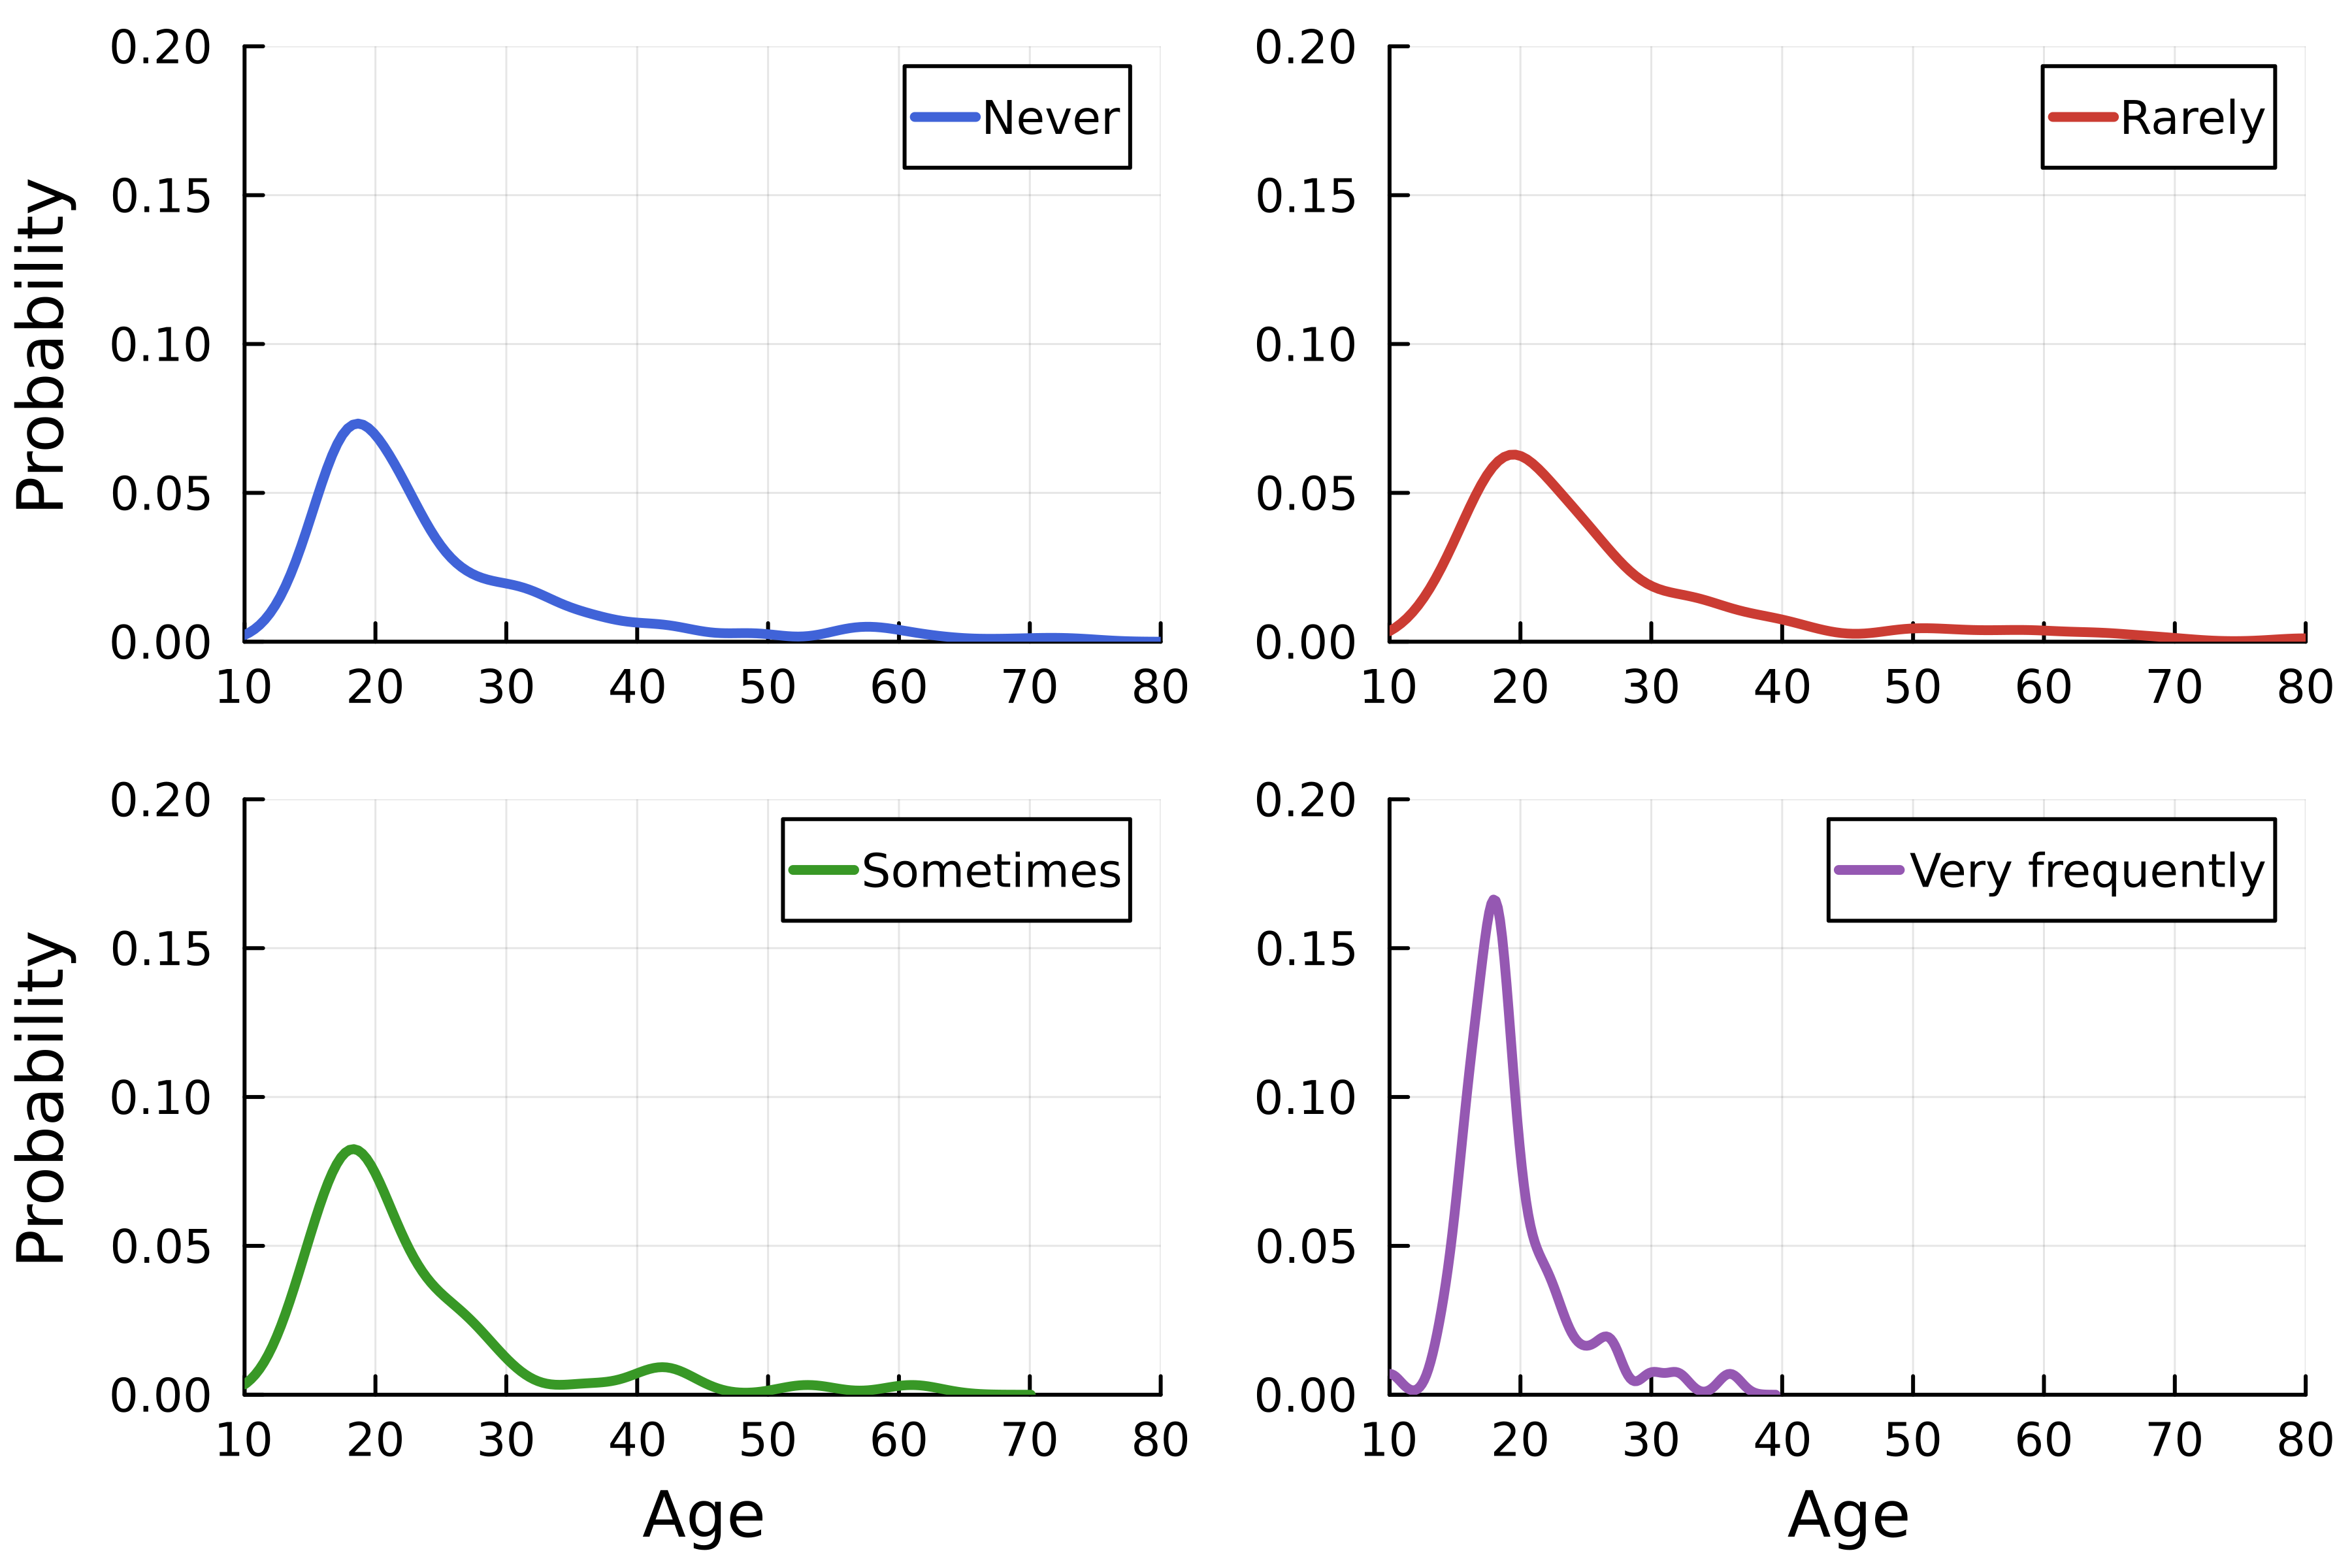
density( streaming.Age, group=streaming."Frequency [K pop]", linewidth=2.5, linecolor=colors,# Kích thước bố cục layout=(4, 1),# Nhãn trục xlabel=["" "" "" "Age"], ylabel="Probability", )# Giới hạn trục xlims!(10, 80) ylims!(0, 0.2)


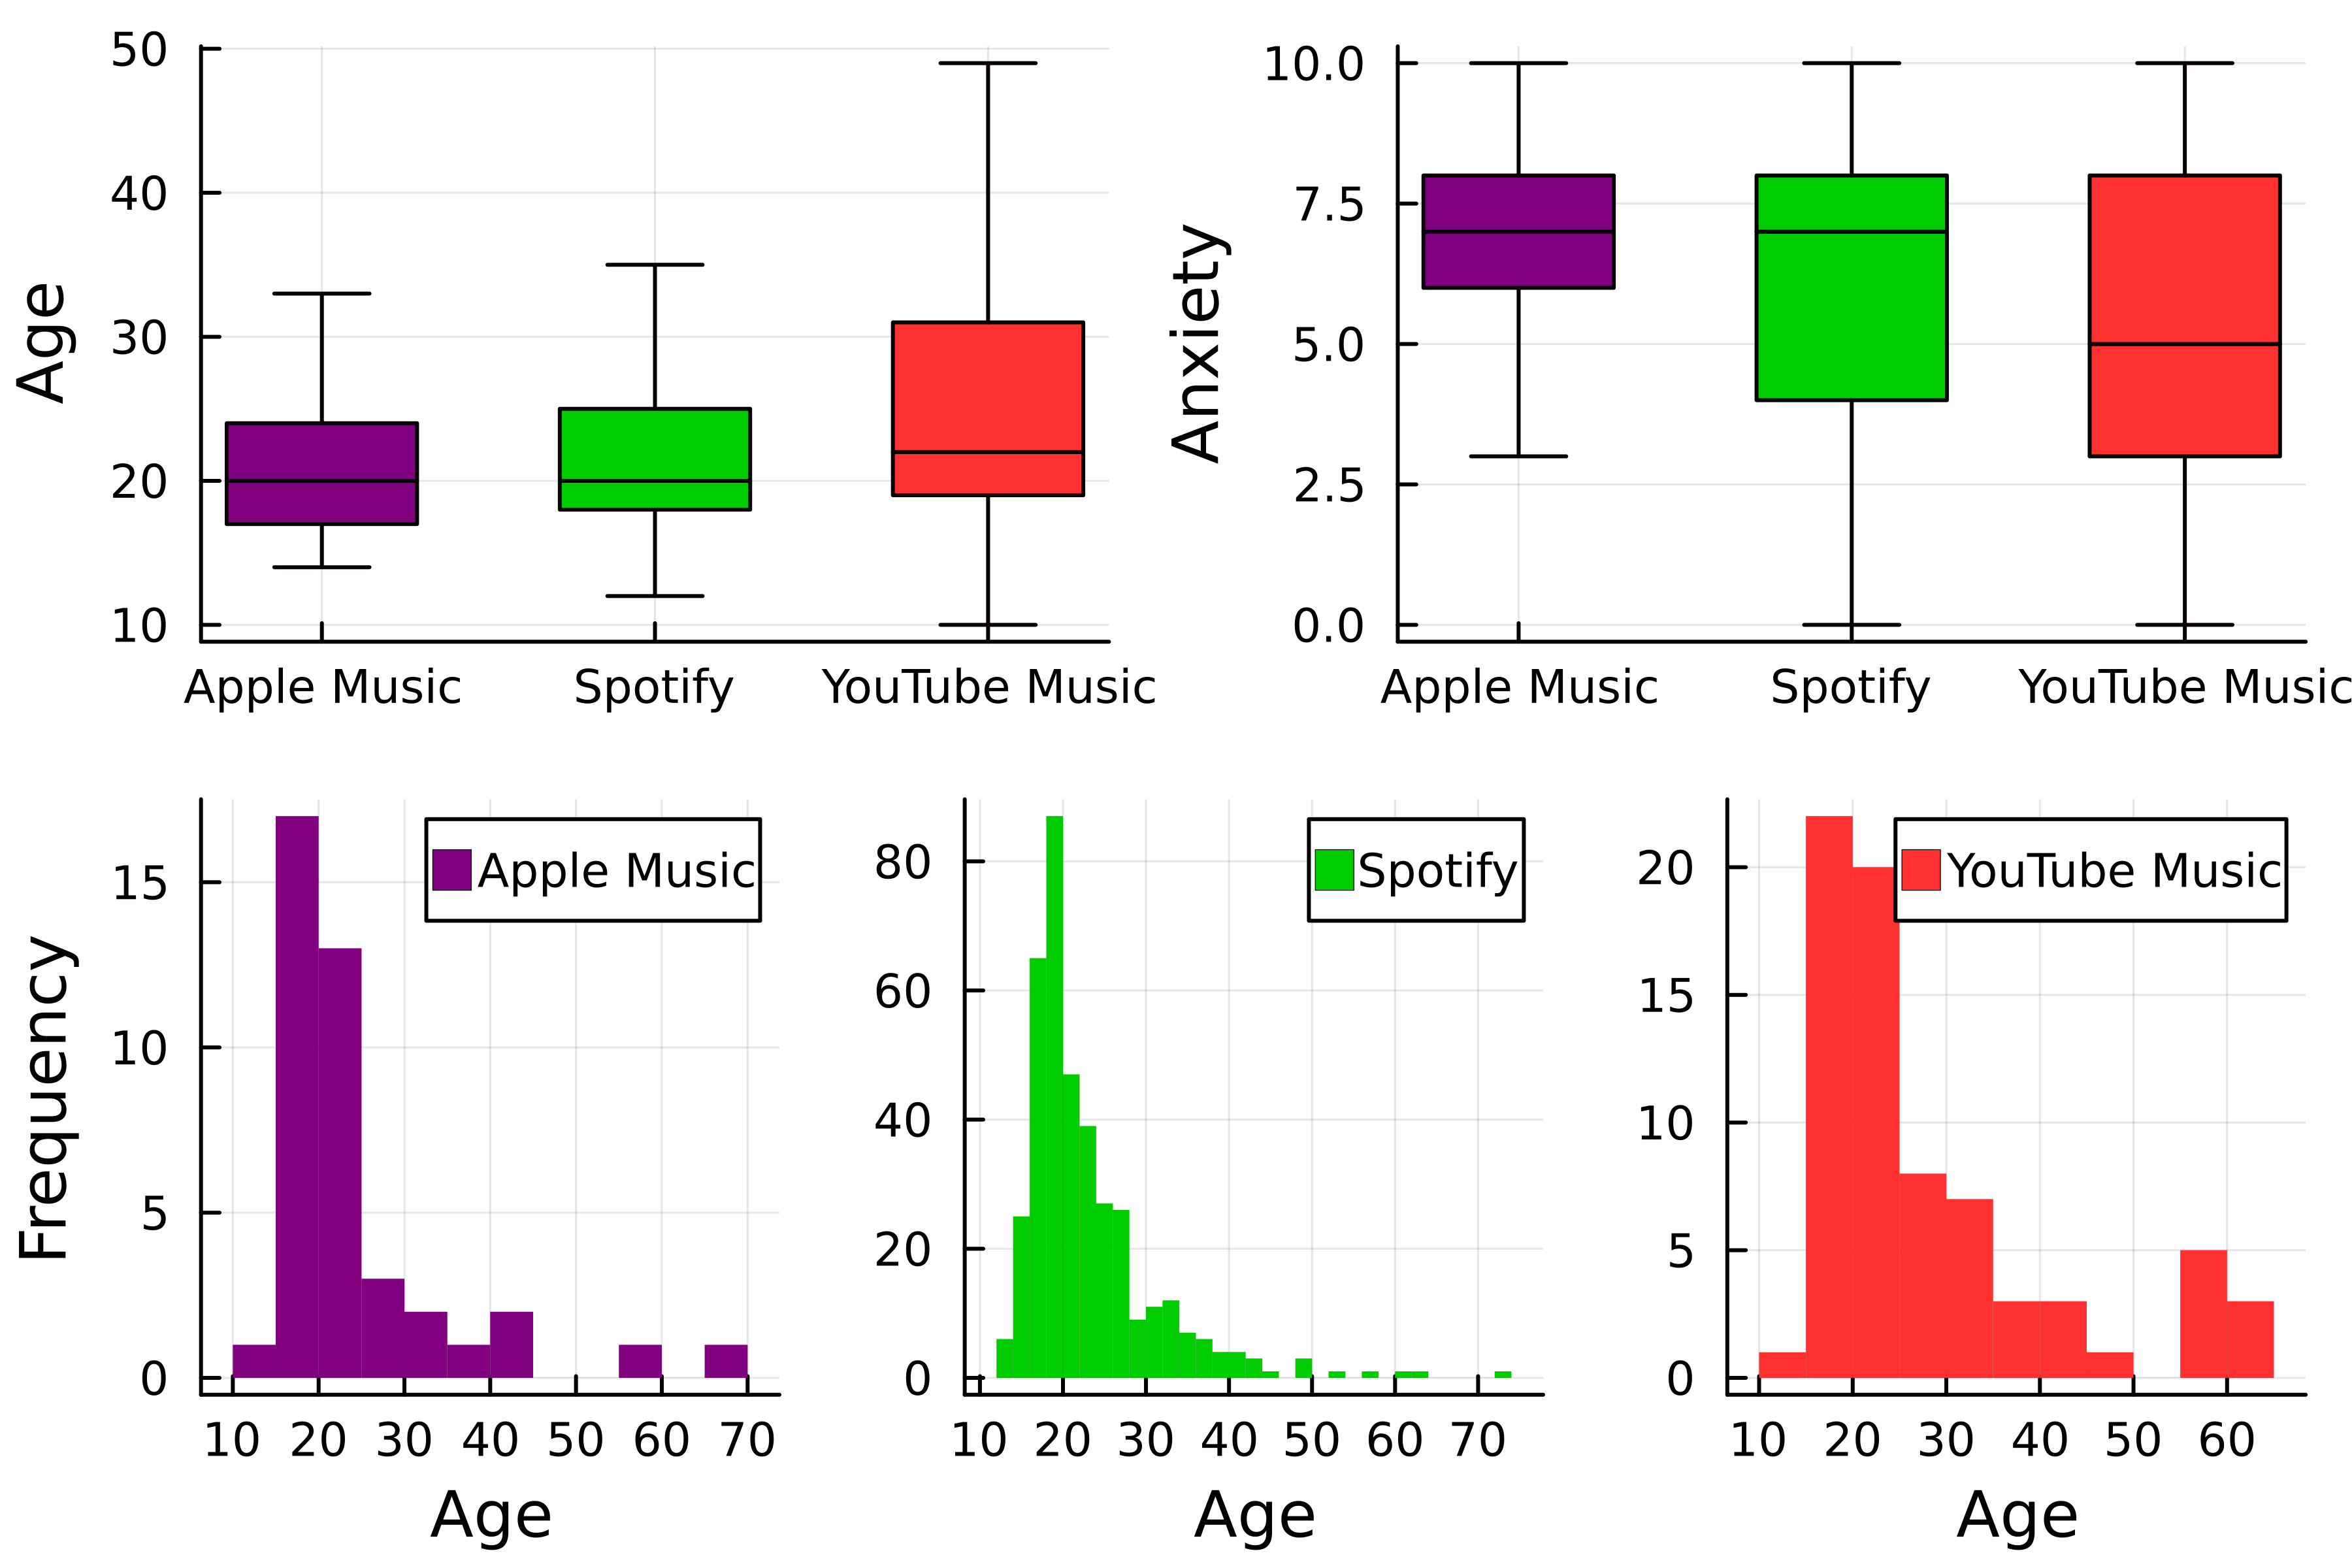
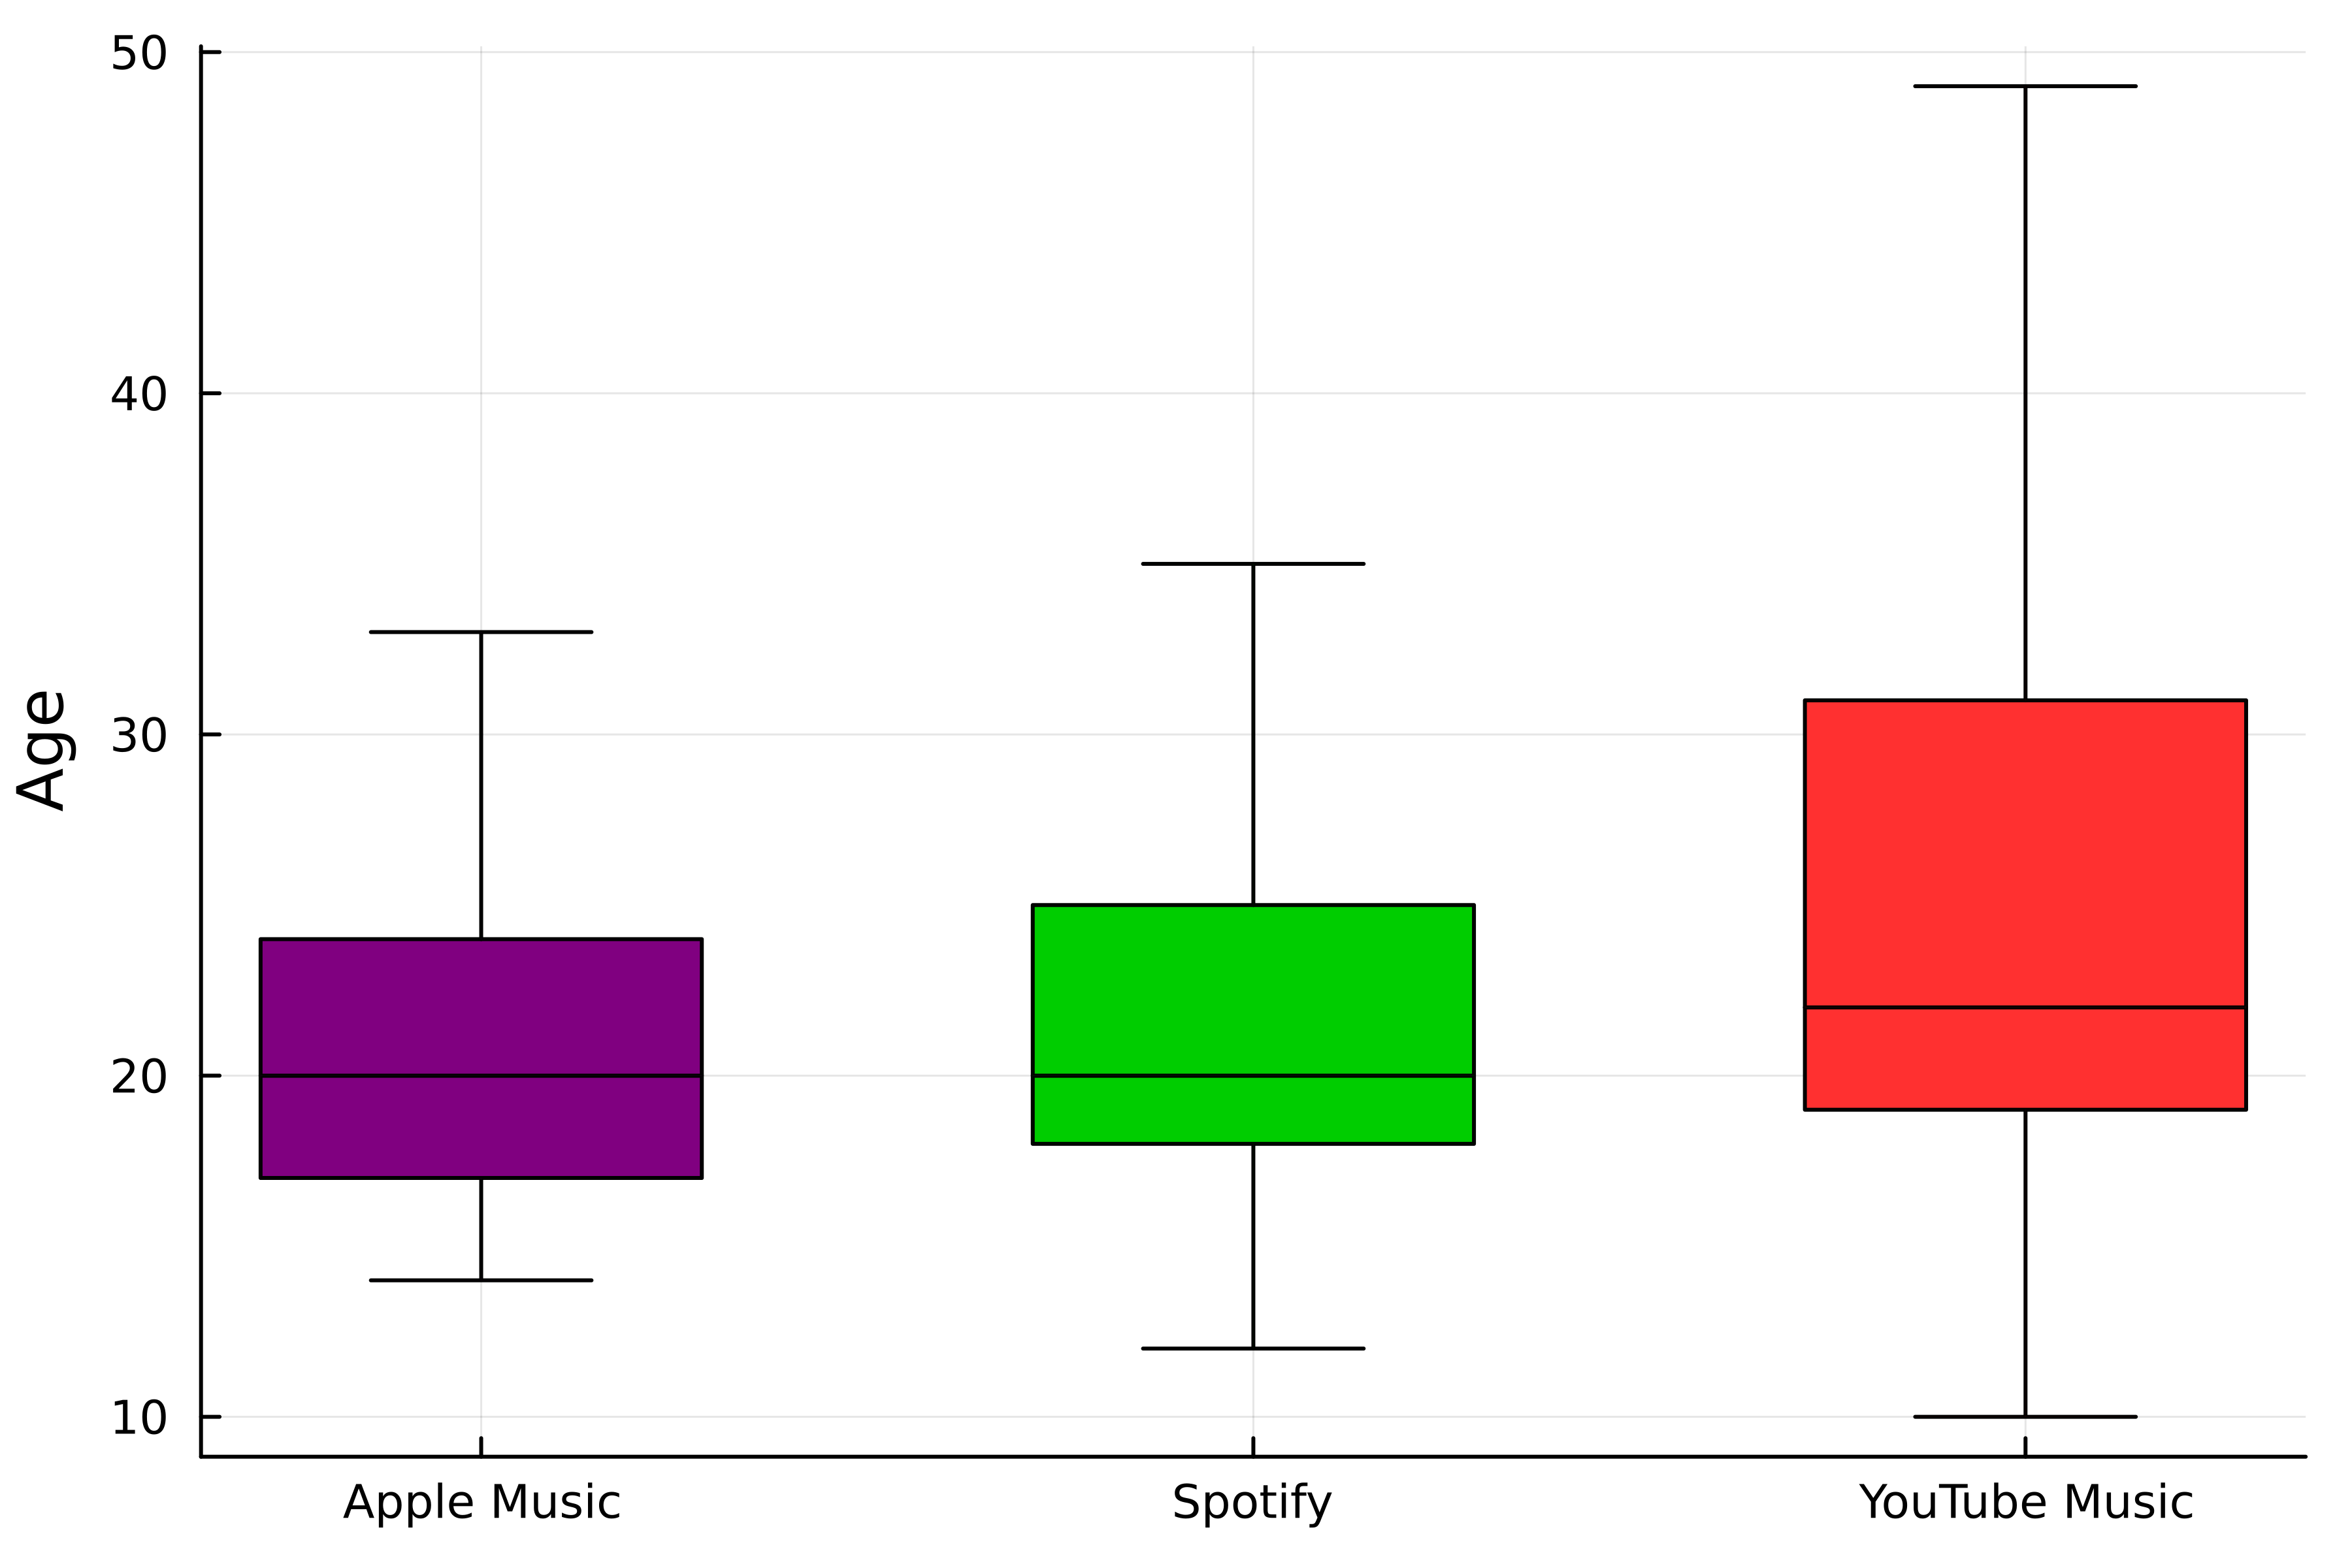
theme(:wong) # Chọn màu colors = [:purple :green3 :firebrick1]# Box plot thứ nhất p1 = boxplot(streaming."Streaming service", streaming.Age,# Nhóm theo dịch vụ group=streaming."Streaming service", color=colors,label=false, ylabel="Age", # Bỏ ngoại lệ outliers=false)

# Box plot thứ hai
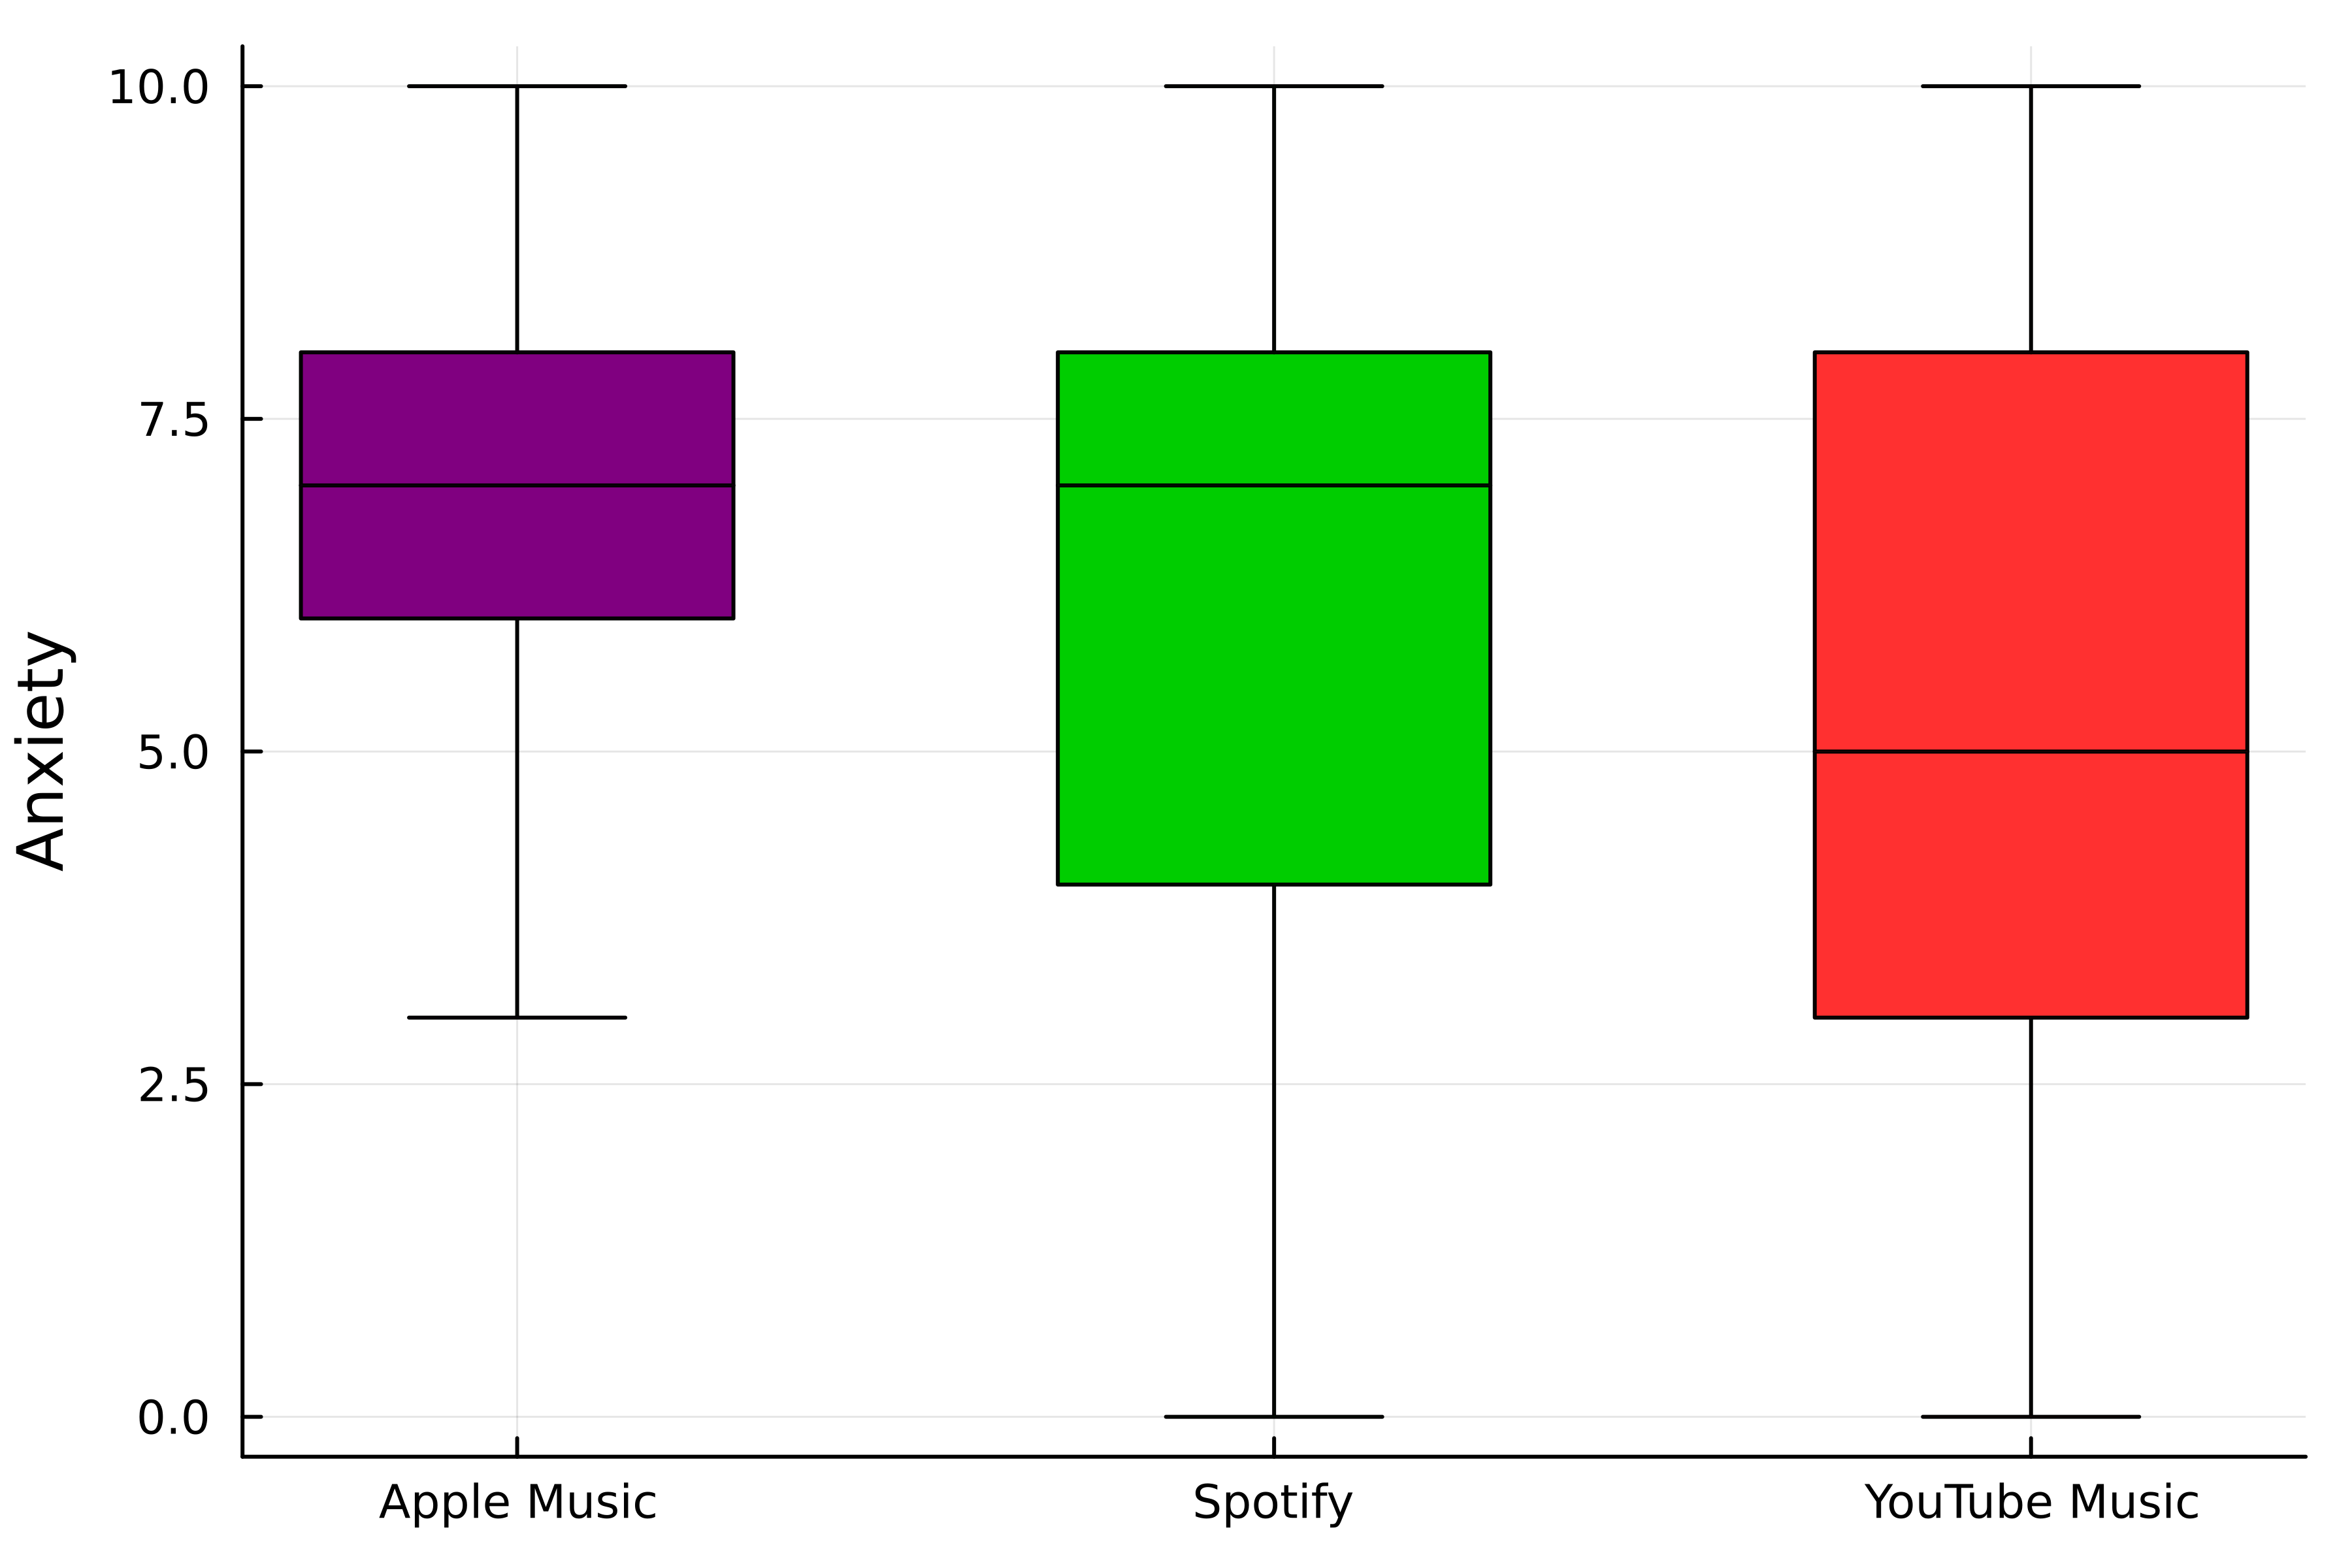
p2 = boxplot(
streaming."Streaming service",
streaming.Anxiety,
# Nhóm theo dịch vụ
group=streaming."Streaming service",
color=colors,
label=false,
ylabel="Anxiety",
# Bỏ ngoại lệ
outliers=false,
)

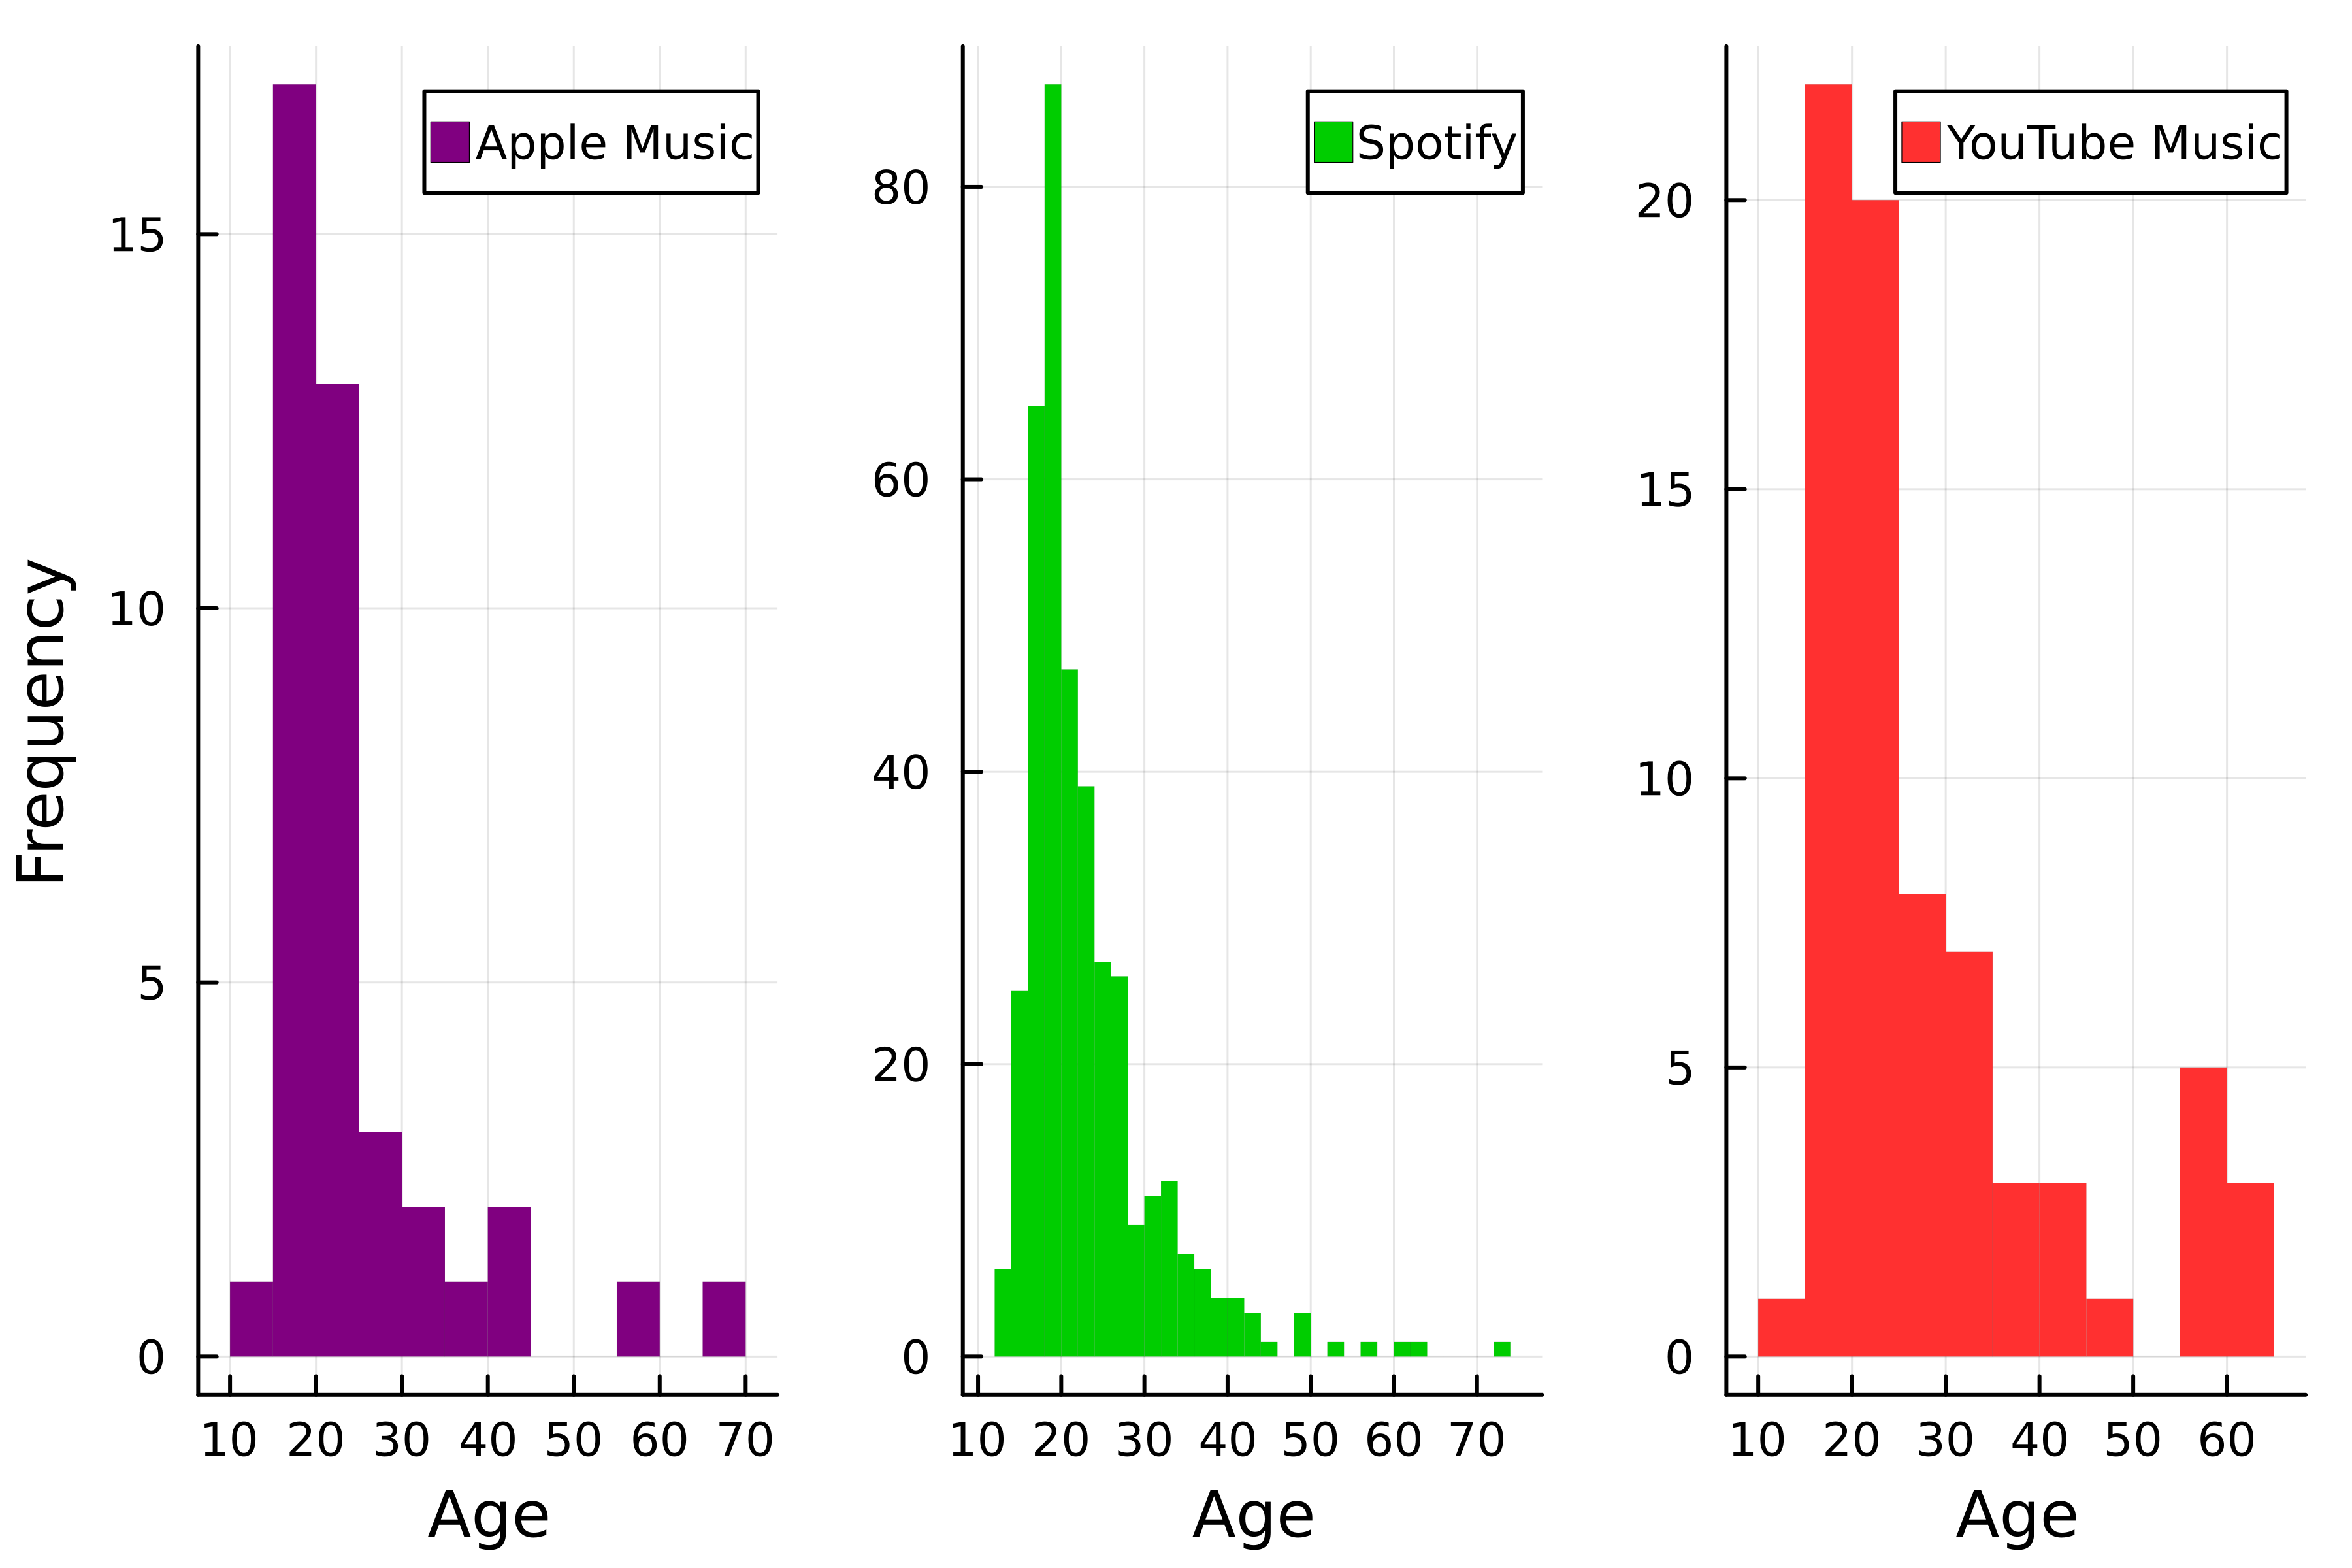
# Histogram p3 = histogram( streaming.Age, group=streaming."Streaming service", color=colors, # Bỏ đường viền linewidth=0,# Thiết lập bố cục layout=(1, 3),xlabel="Age", # Thiết lập nhãn trục y ylabel=["Frequency" "" ""] )

# Chọn bố cục
layout = @layout [a b; c]

# Ghép các biểu đồ
plot(p1, p2, p3, layout=layout)

Nhập môn Trực quan hóa Dữ liệu với Julia