Phát hiện nhiều bất thường trong chuỗi thời gian theo mùa

Giới thiệu về Anomaly Detection bằng R

Alastair Rushworth

Data Scientist

Dữ liệu doanh thu theo tháng

head(msales)
  sales month
1 6.068     1
2 5.966     2
3 6.133     3
4 6.230     4
5 6.407     5
6 6.433     6

Kiểm định Grubbs không phù hợp ở đây

  • Có thể có tính mùa vụ
  • Có thể có nhiều điểm bất thường
Giới thiệu về Anomaly Detection bằng R

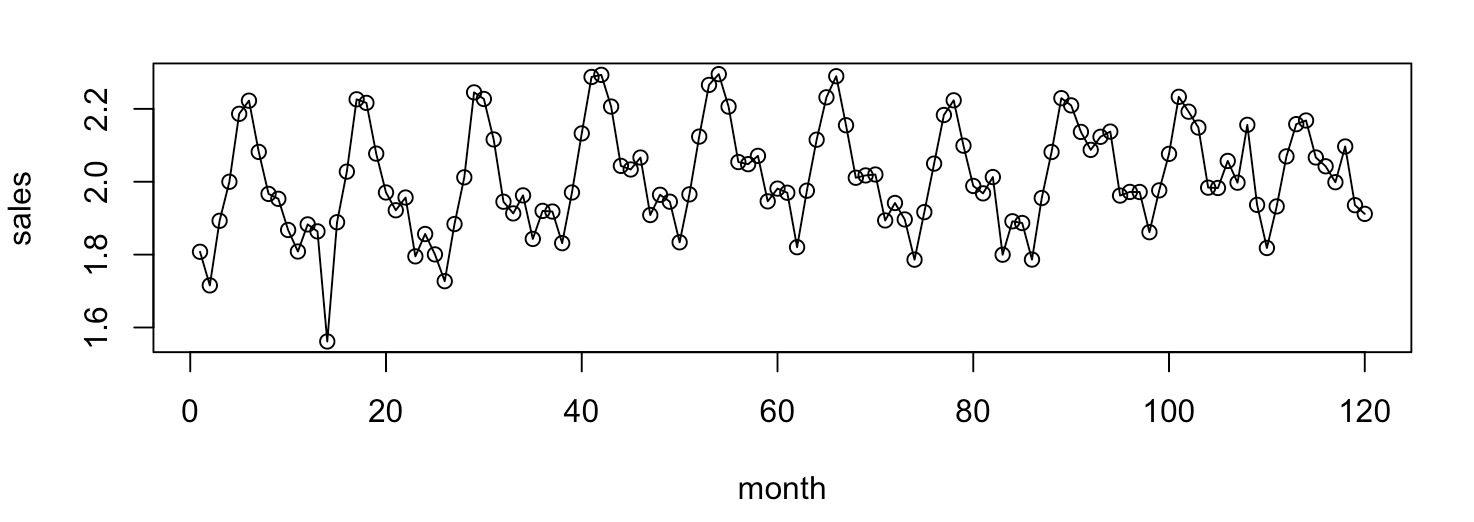
Trực quan hóa doanh thu theo tháng

plot(sales ~ month, data = msales, type = 'o')
Giới thiệu về Anomaly Detection bằng R

Cách dùng thuật toán Seasonal-Hybrid ESD

library(AnomalyDetection)
sales_ad <- AnomalyDetectionVec(x = msales$sales, period = 12, 
                                direction = 'both')

Tham số

  • x: vector giá trị
  • period: chu kỳ lặp lại
  • direction: tìm điểm bất thường nhỏ ('neg'), lớn ('pos'), hoặc cả hai ('both')

Tải gói từ https://github.com/twitter/AnomalyDetection

Giới thiệu về Anomaly Detection bằng R

Kết quả thuật toán Seasonal-Hybrid ESD

sales_ad <- AnomalyDetectionVec(x = msales$sales, period = 12, 
                                direction = 'both')
sales_ad$anoms
  index anoms
1    14 1.561
2   108 2.156
Giới thiệu về Anomaly Detection bằng R

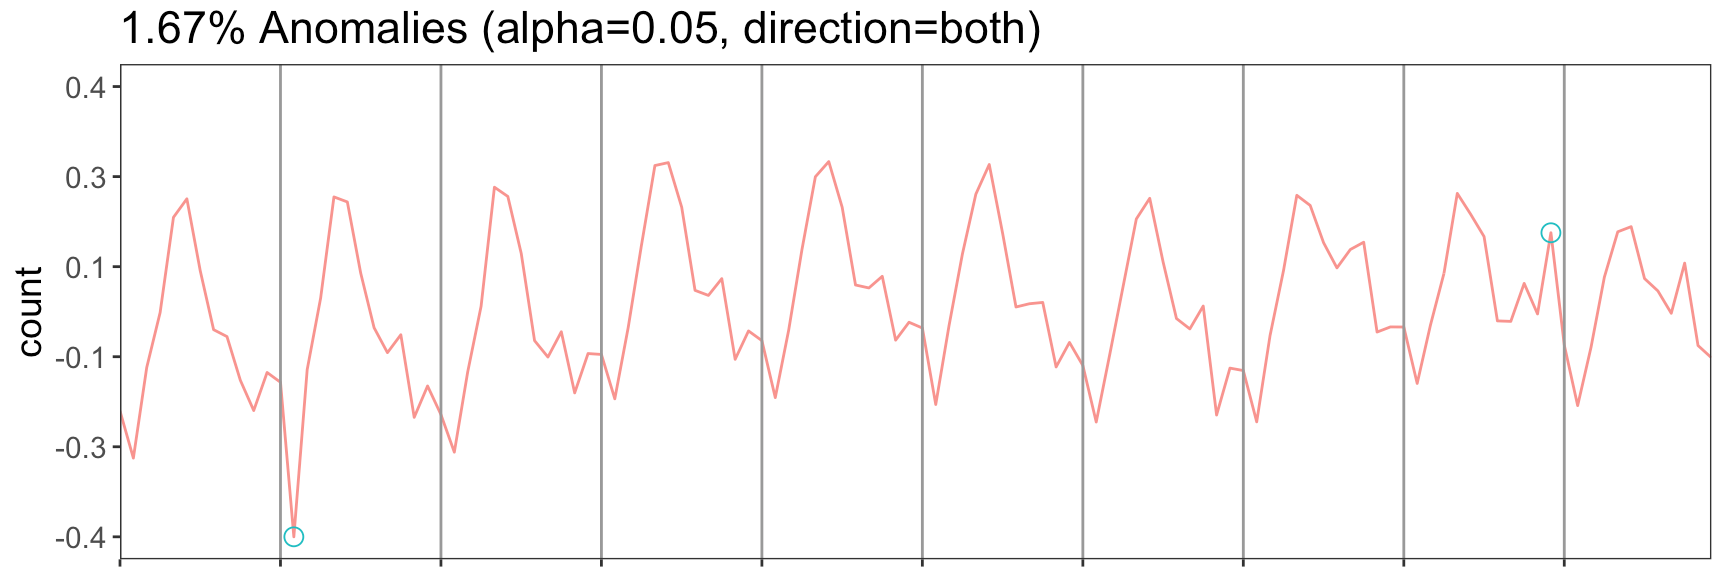
Biểu đồ thuật toán Seasonal-Hybrid ESD

AnomalyDetectionVec(x = msales$sales, period = 12, 
                    direction = 'both', plot = T)
Giới thiệu về Anomaly Detection bằng R

Ayo berlatih!

Giới thiệu về Anomaly Detection bằng R

Preparing Video For Download...