Chuỗi thời gian theo mùa
Mô hình ARIMA với Python

James Fulton
Climate informatics researcher
Phân rã theo mùa
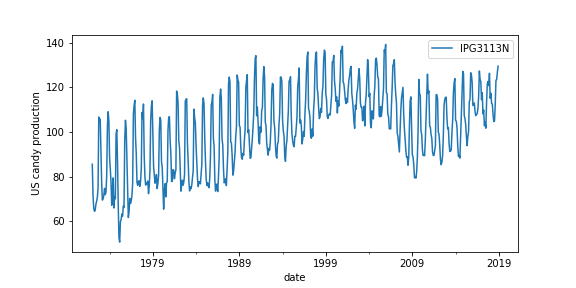
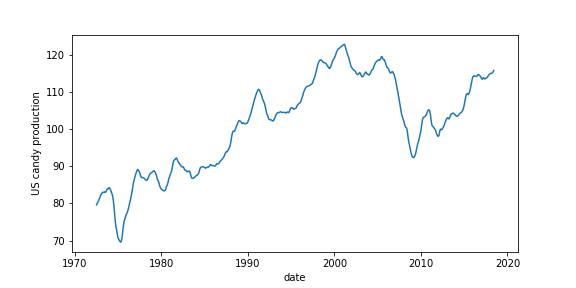
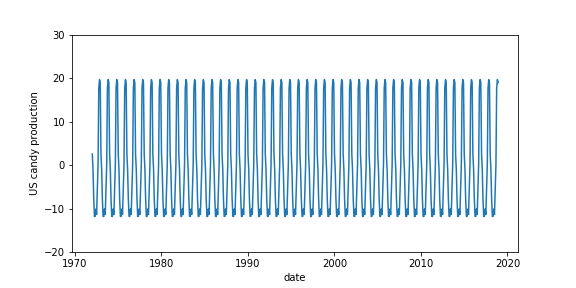
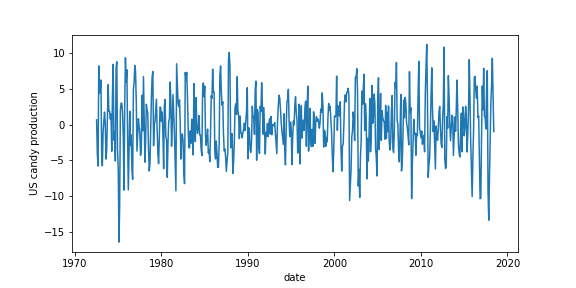
Phân rã theo mùa
time series = trend + seasonal + residual
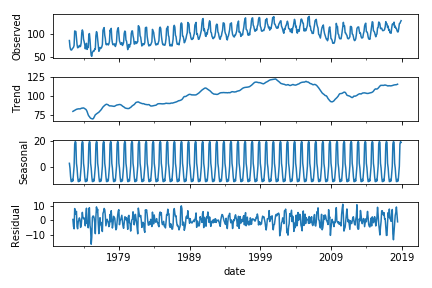
Phân rã theo mùa với statsmodels
# Vẽ dữ liệu đã phân rã
decomp_results.plot()
plt.show()
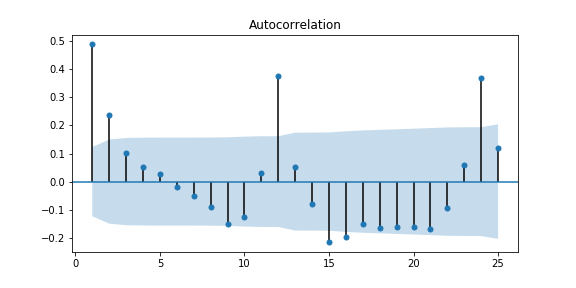
Tìm chu kỳ mùa bằng ACF
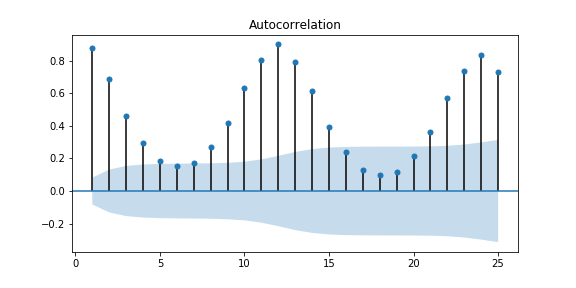
Nhận diện dữ liệu theo mùa bằng ACF
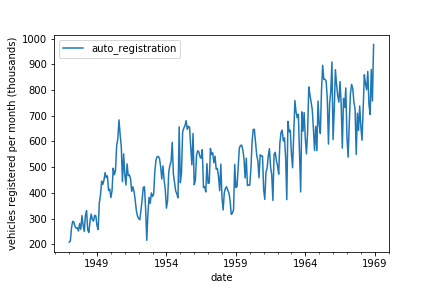
Khử xu hướng chuỗi thời gian
# Trừ trung bình trượt dài trong N bước df = df - df.rolling(N).mean()# Bỏ các giá trị NaN df = df.dropna()
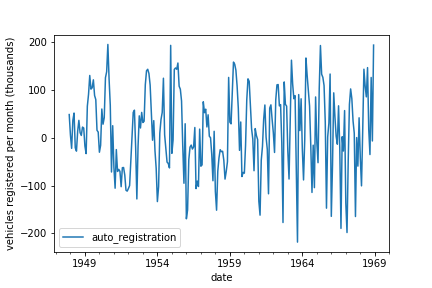
Nhận diện dữ liệu theo mùa bằng ACF
# Tạo hình
fig, ax = plt.subplots(1,1, figsize=(8,4))

# Vẽ ACF
plot_acf(df.dropna(), ax=ax, lags=25, zero=False)
plt.show()
Mô hình ARIMA và dữ liệu theo mùa