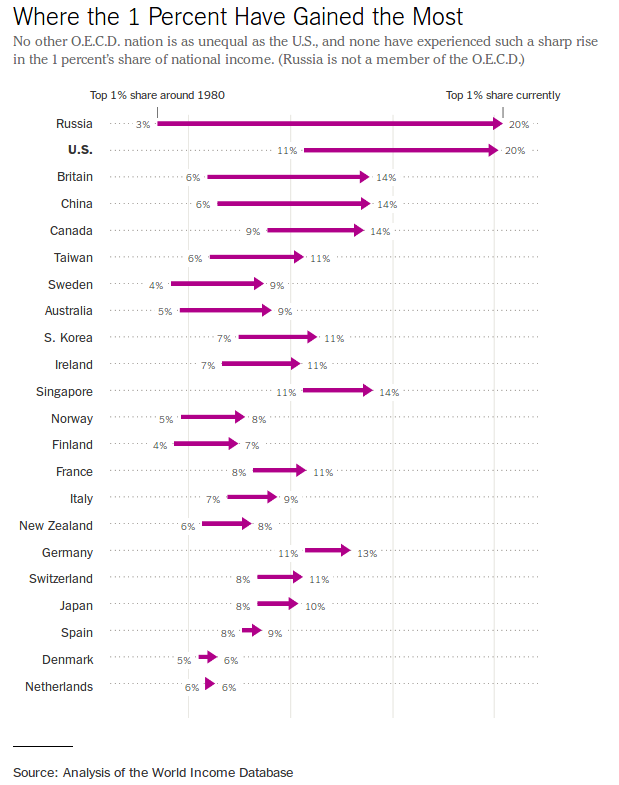
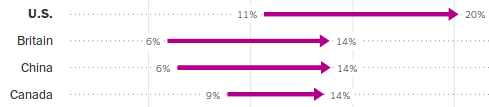
Biểu đồ tùy chỉnh để làm nổi bật thay đổi

Truyền đạt bằng Dữ liệu trong Tidyverse

Timo Grossenbacher

Data Journalist
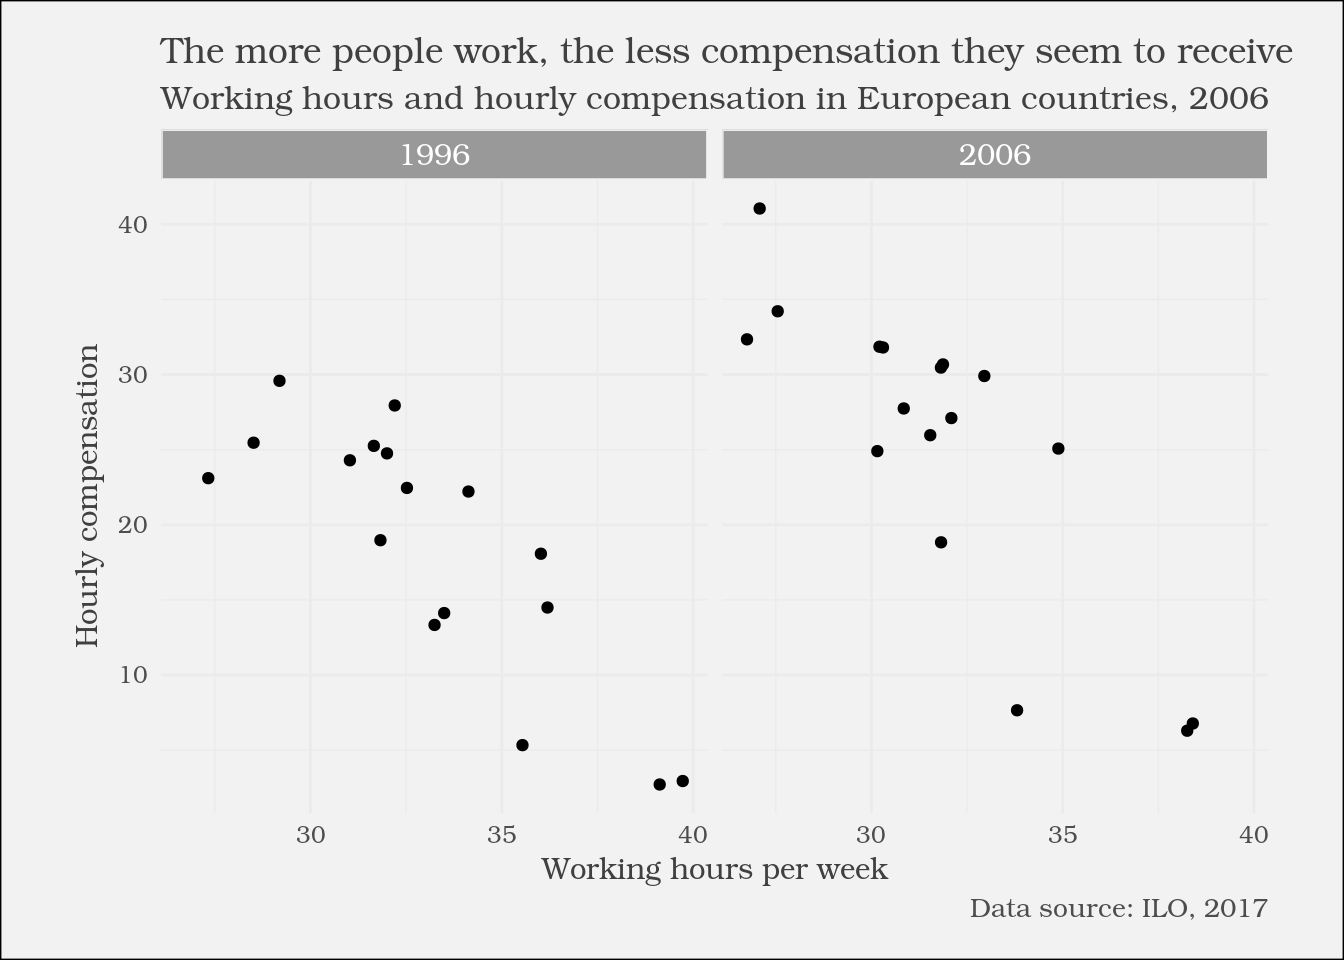
Truyền đạt bằng Dữ liệu trong Tidyverse

Biểu đồ chấm

1 New York Times (https://www.nytimes.com/2017/11/17/upshot/income-inequality-united-states.html){{0}}
Truyền đạt bằng Dữ liệu trong Tidyverse

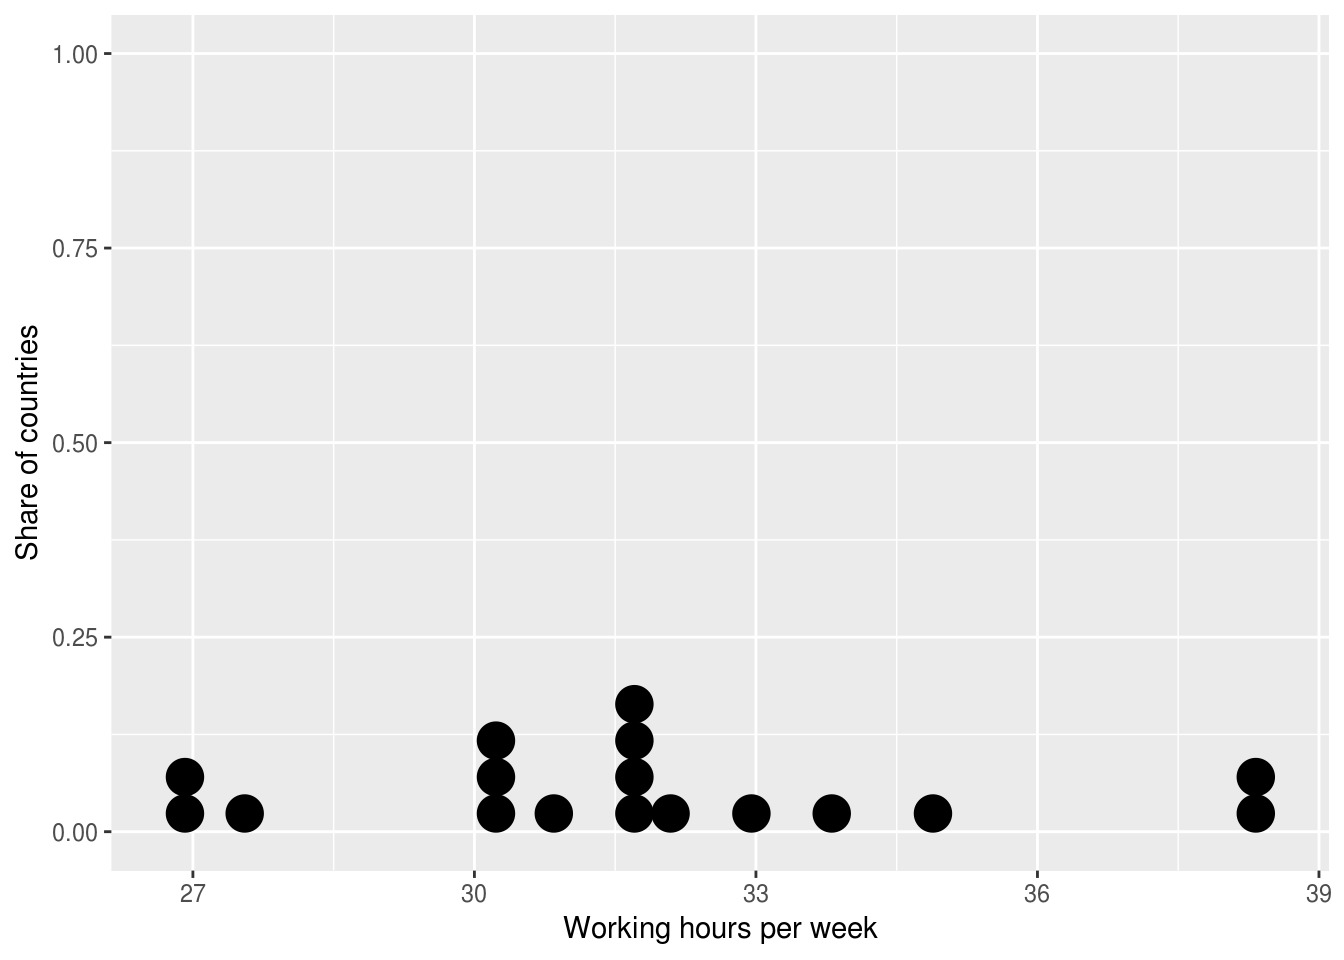
Biểu đồ chấm với ggplot2

ggplot((ilo_data %>% filter(year == 2006))) +
  geom_dotplot(aes(x = working_hours)) +
  labs(x = "Working hours per week",
       y = "Share of countries")
Truyền đạt bằng Dữ liệu trong Tidyverse

Hàm geom_path()

?geom_path

geom_path() nối các quan sát theo đúng thứ tự chúng xuất hiện trong dữ liệu.

ilo_data %>% 
    arrange(country)
# A tibble: 34 x 4
     country   year hourly_compensation working_hours
       <fct>  <fct>               <dbl>         <dbl>
1    Austria   1996               24.75      31.99808
2    Austria   2006               30.46      31.81731
3    Belgium   1996               25.25      31.65385
4    Belgium   2006               31.85      30.21154
5 Czech Rep.   1996                2.94      39.72692
# ... with 29 more rows
Truyền đạt bằng Dữ liệu trong Tidyverse

Biểu đồ chấm với `ggplot2`: hàm `geom_path()`

ggplot() +
    geom_path(aes(x = numeric_variable, y = numeric_variable))
ggplot() +
    geom_path(aes(x = numeric_variable, y = factor_variable))
ggplot() +
    geom_path(aes(x = numeric_variable, y = factor_variable),
                arrow = arrow(___))
Truyền đạt bằng Dữ liệu trong Tidyverse

Hãy thử geom_path!

Truyền đạt bằng Dữ liệu trong Tidyverse

Preparing Video For Download...