Tùy biến theme trong ggplot2

Truyền đạt bằng Dữ liệu trong Tidyverse

Timo Grossenbacher

Data Journalist

Lợi ích của giao diện tùy biến
Truyền đạt bằng Dữ liệu trong Tidyverse

Hàm theme()

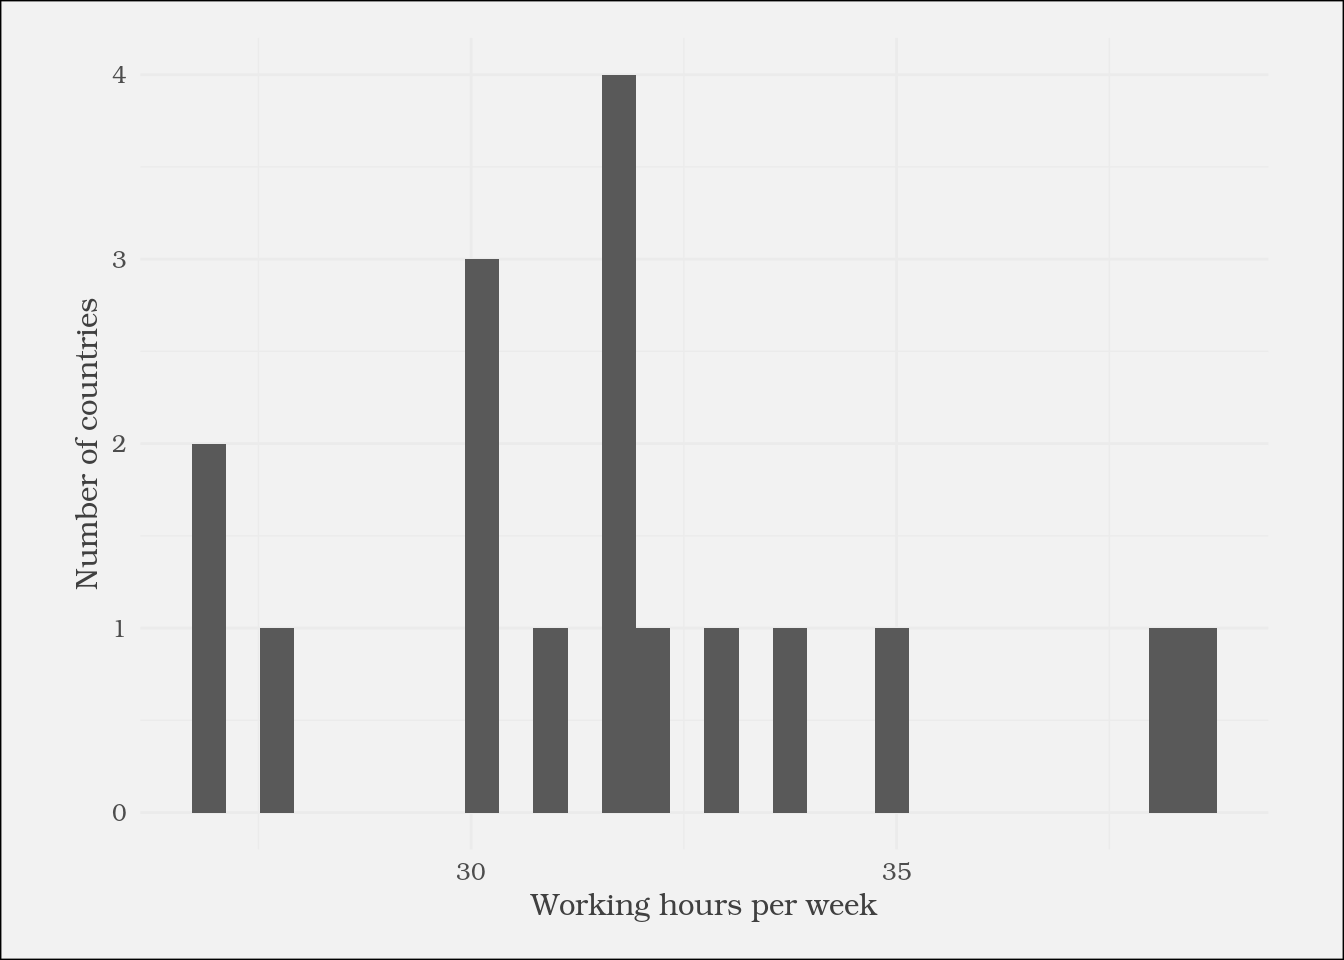
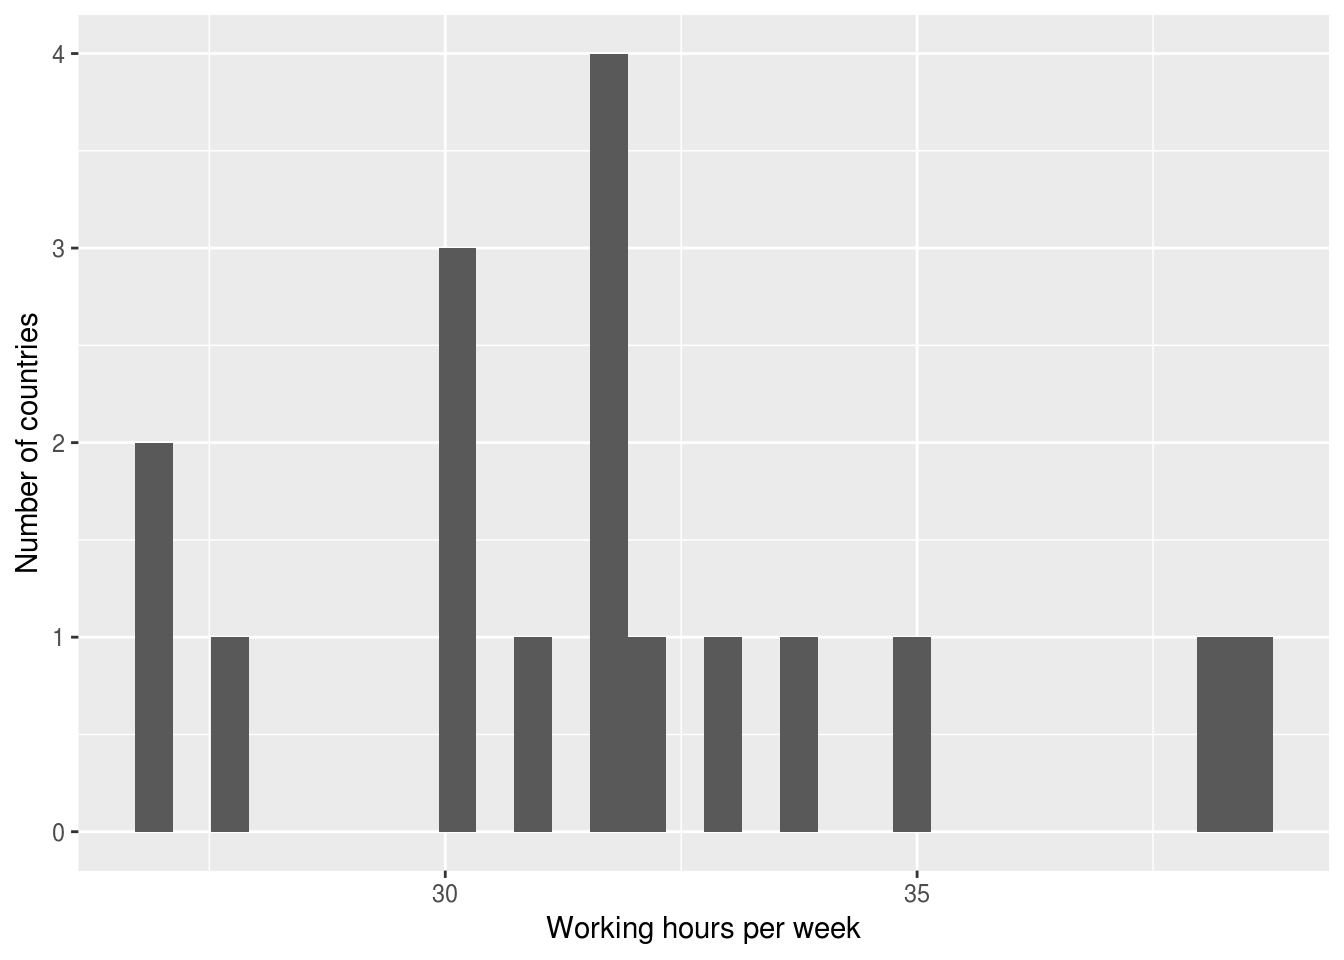
ggplot(plot_data) +
  geom_histogram(aes(
    x = working_hours)) +
  labs(x = "Working hours per week",
       y = "Number of countries") +
  theme(
    text = element_text(
      family = "Bookman",
      color = "gray25")
  )

Truyền đạt bằng Dữ liệu trong Tidyverse

Các theme mặc định của ggplot2

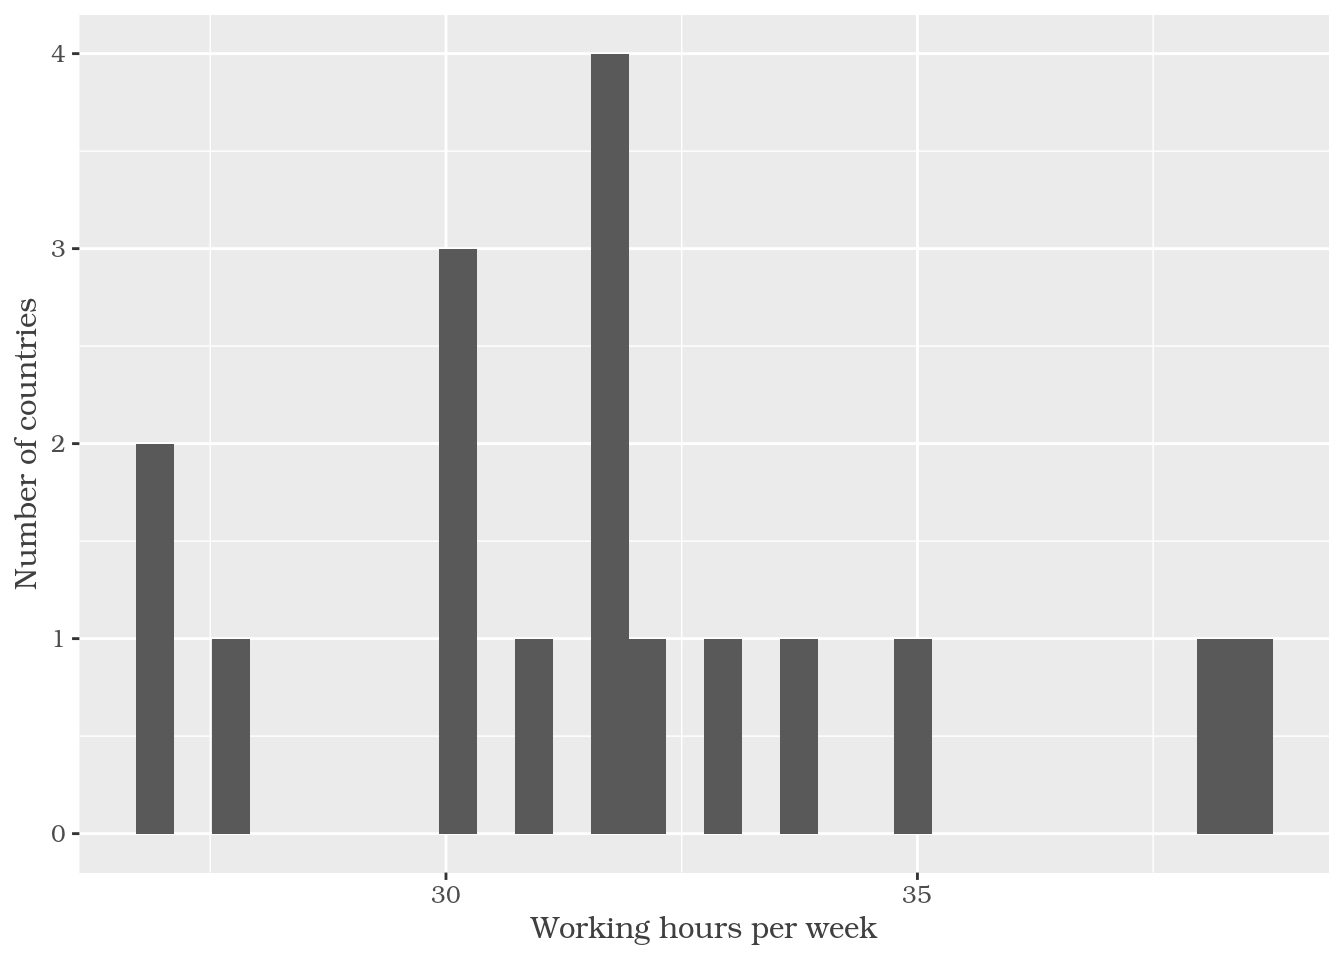
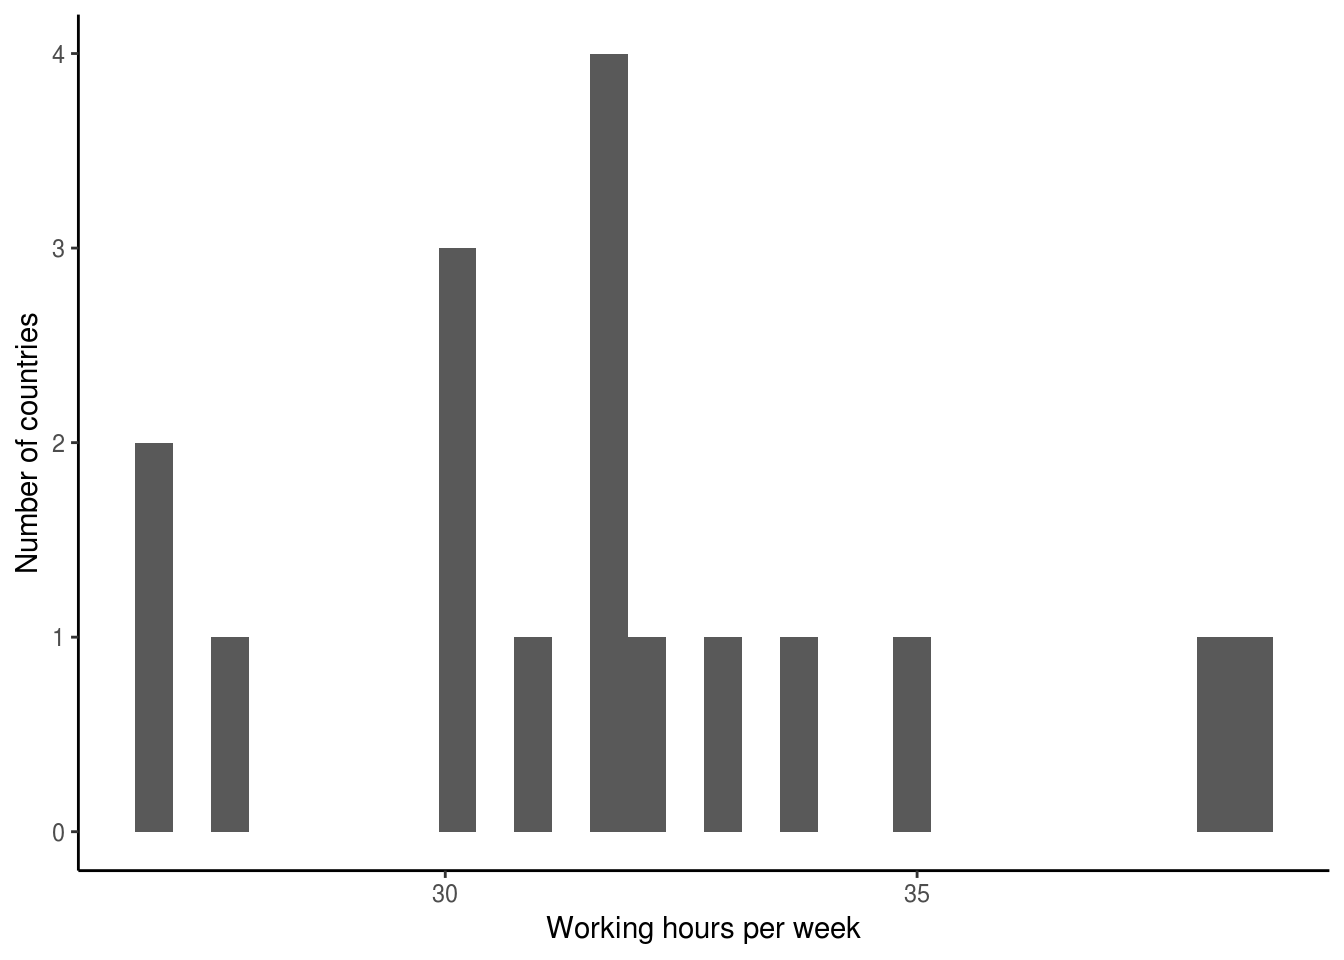
ggplot(plot_data) +
  geom_histogram(aes(
    x = working_hours)) +
  labs(x = "Working hours per week",
       y = "Number of countries") +

  theme_classic()

Truyền đạt bằng Dữ liệu trong Tidyverse

Xâu chuỗi các lệnh theme()

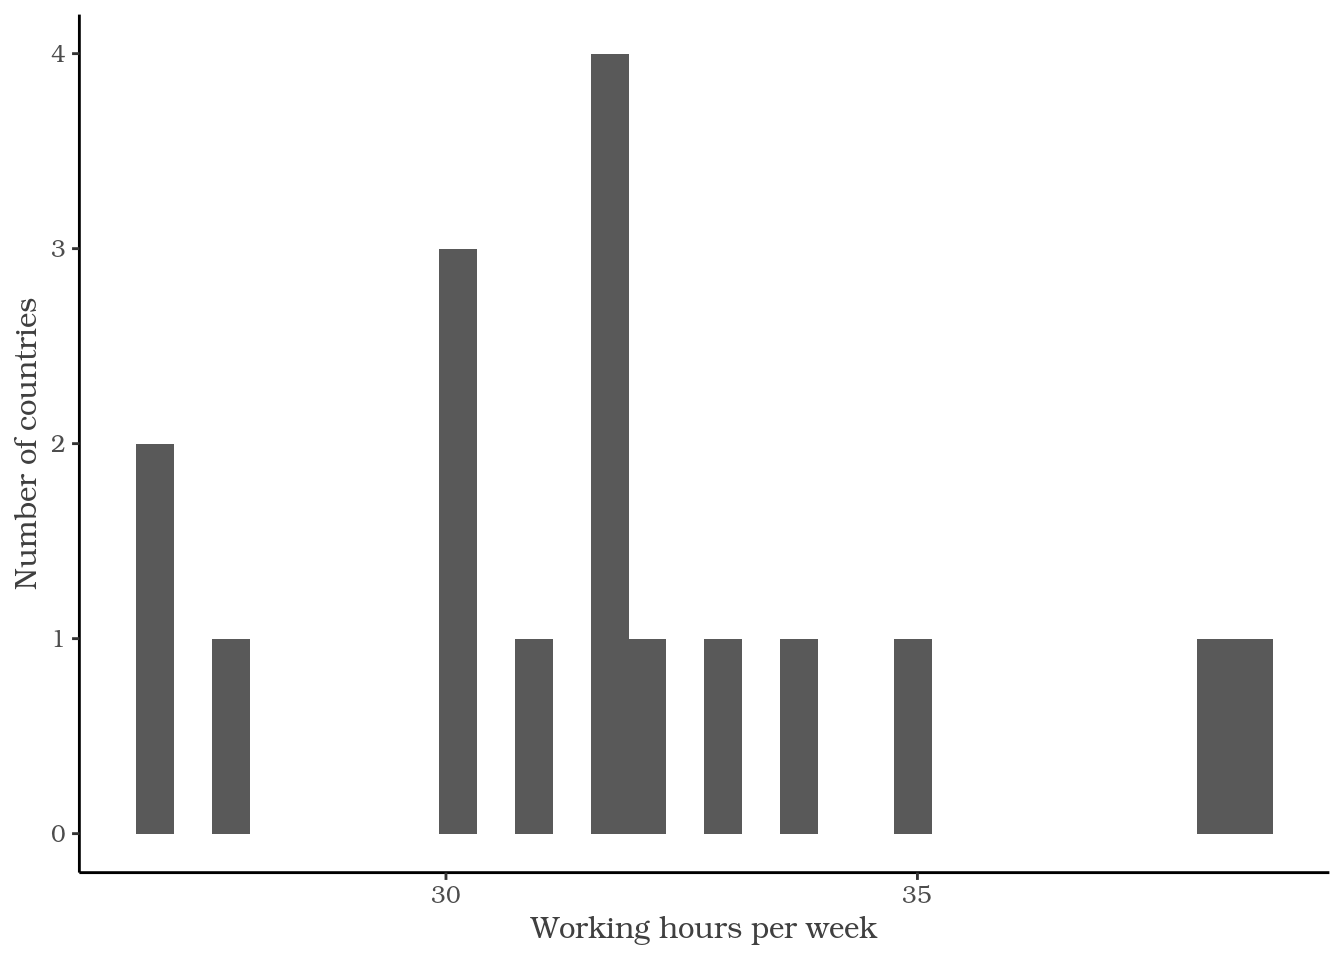
ggplot(plot_data) +
  geom_histogram(aes(
    x = working_hours)) +
  labs(x = "Working hours per week",
       y = "Number of countries") +

  theme_classic() +
  theme(
    text = element_text(
      family = "Bookman",
      color = "gray25")
  )

Truyền đạt bằng Dữ liệu trong Tidyverse

Tùy chọn cấu hình theme

?theme

axis.title
nhãn trục (element_text; kế thừa từ text)

axis.title.x
nhãn trục x (element_text; kế thừa từ axis.title)

axis.title.x.top
nhãn trục x ở trục trên (element_text; kế thừa từ axis.title.x)

axis.title.x.bottom
nhãn trục x ở trục dưới (element_text; kế thừa từ axis.title.x)

Truyền đạt bằng Dữ liệu trong Tidyverse

Họ hàm element_*

element_text()
element_rect()
element_line()
element_blank()
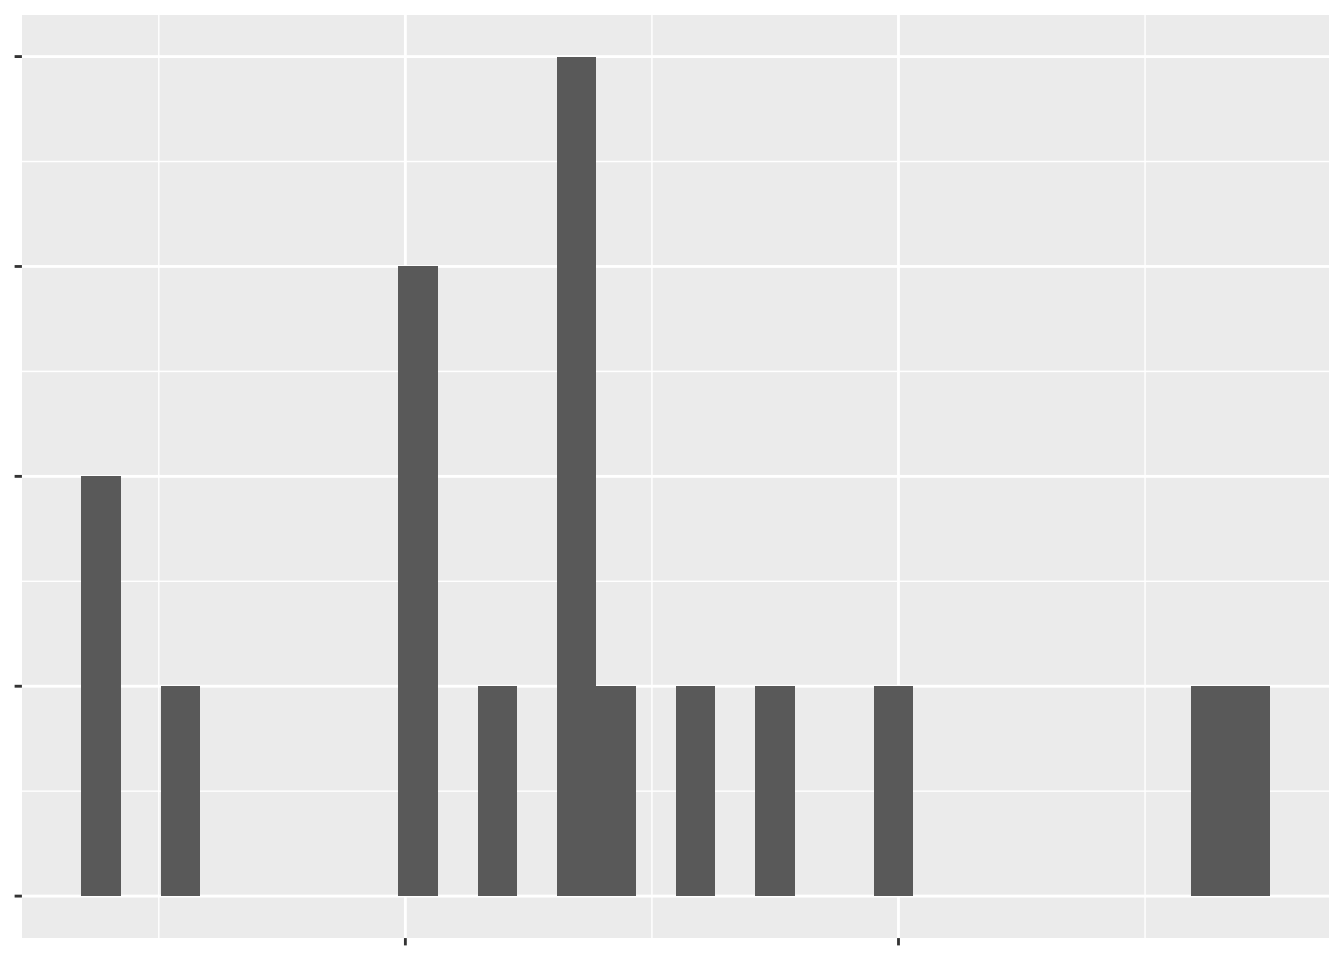
ggplot(plot_data) +
  geom_histogram(aes(
    x = working_hours)) +
  labs(x = "Working hours per week",
       y = "Number of countries") +
  theme(
    text = element_blank()
  )

Truyền đạt bằng Dữ liệu trong Tidyverse

Cùng luyện tập nào!

Truyền đạt bằng Dữ liệu trong Tidyverse

Preparing Video For Download...