Trực quan các khía cạnh dữ liệu với facets

Truyền đạt bằng Dữ liệu trong Tidyverse

Timo Grossenbacher

Data Journalist

Hàm facet_grid()
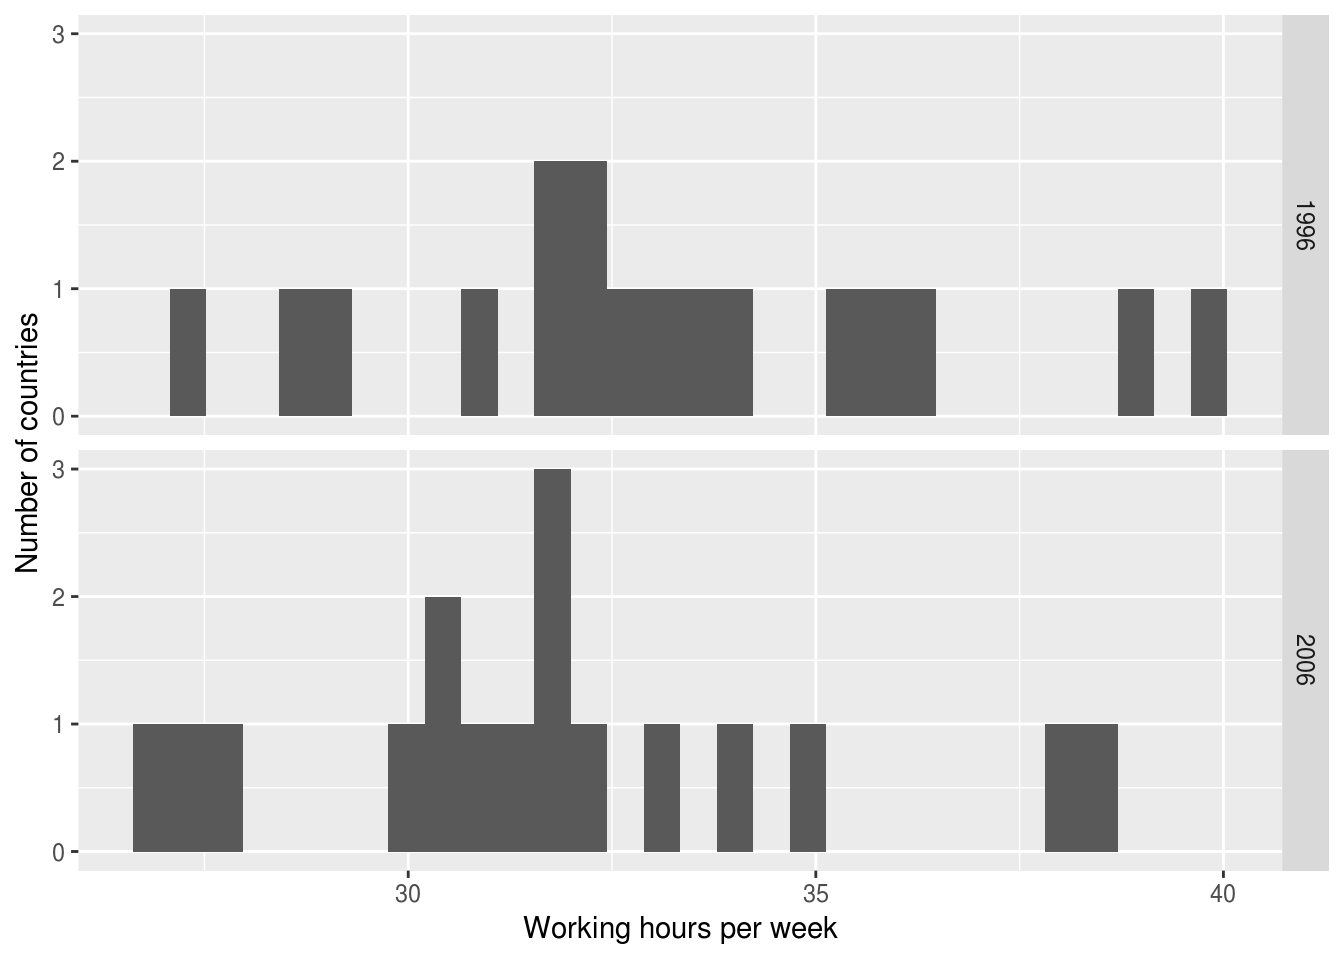
ilo_data <- ilo_data %>%
  filter(year == "1996" | year == "2006") 
ilo_plot <- ggplot(ilo_data) +
  geom_histogram(aes(
    x = working_hours)) +
  labs(x = "Giờ làm việc mỗi tuần",
       y = "Số quốc gia")

ilo_plot +
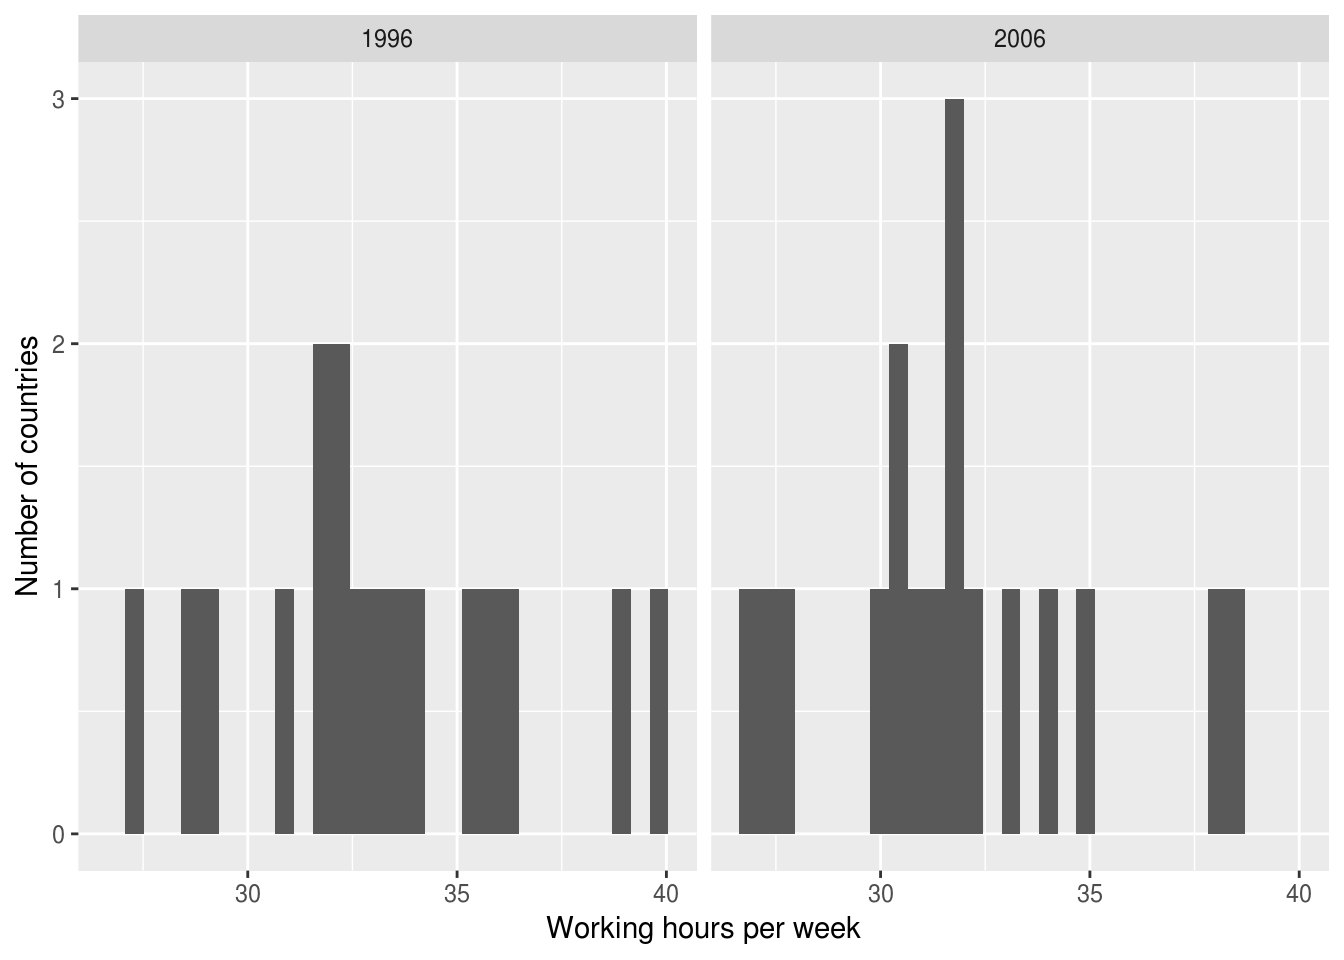
  facet_grid(cols = vars(year))
ilo_plot +
  facet_grid(rows = vars(year))

Truyền đạt bằng Dữ liệu trong Tidyverse

Hàm facet_grid()

ilo_data <- ilo_data %>%
  filter(year == "1996" | year == "2006")
ggplot(ilo_data) +
  geom_histogram(aes(x = working_hours)) +
  labs(x = "Giờ làm việc mỗi tuần",
       y = "Số quốc gia") +
  facet_grid(cols = vars(year))

ggplot(ilo_data) +
  geom_histogram(aes(x = working_hours)) +
  labs(x = "Giờ làm việc mỗi tuần",
       y = "Số quốc gia") +
  facet_wrap(facets = vars(year))

Truyền đạt bằng Dữ liệu trong Tidyverse

Biểu đồ scatter có facets

Truyền đạt bằng Dữ liệu trong Tidyverse

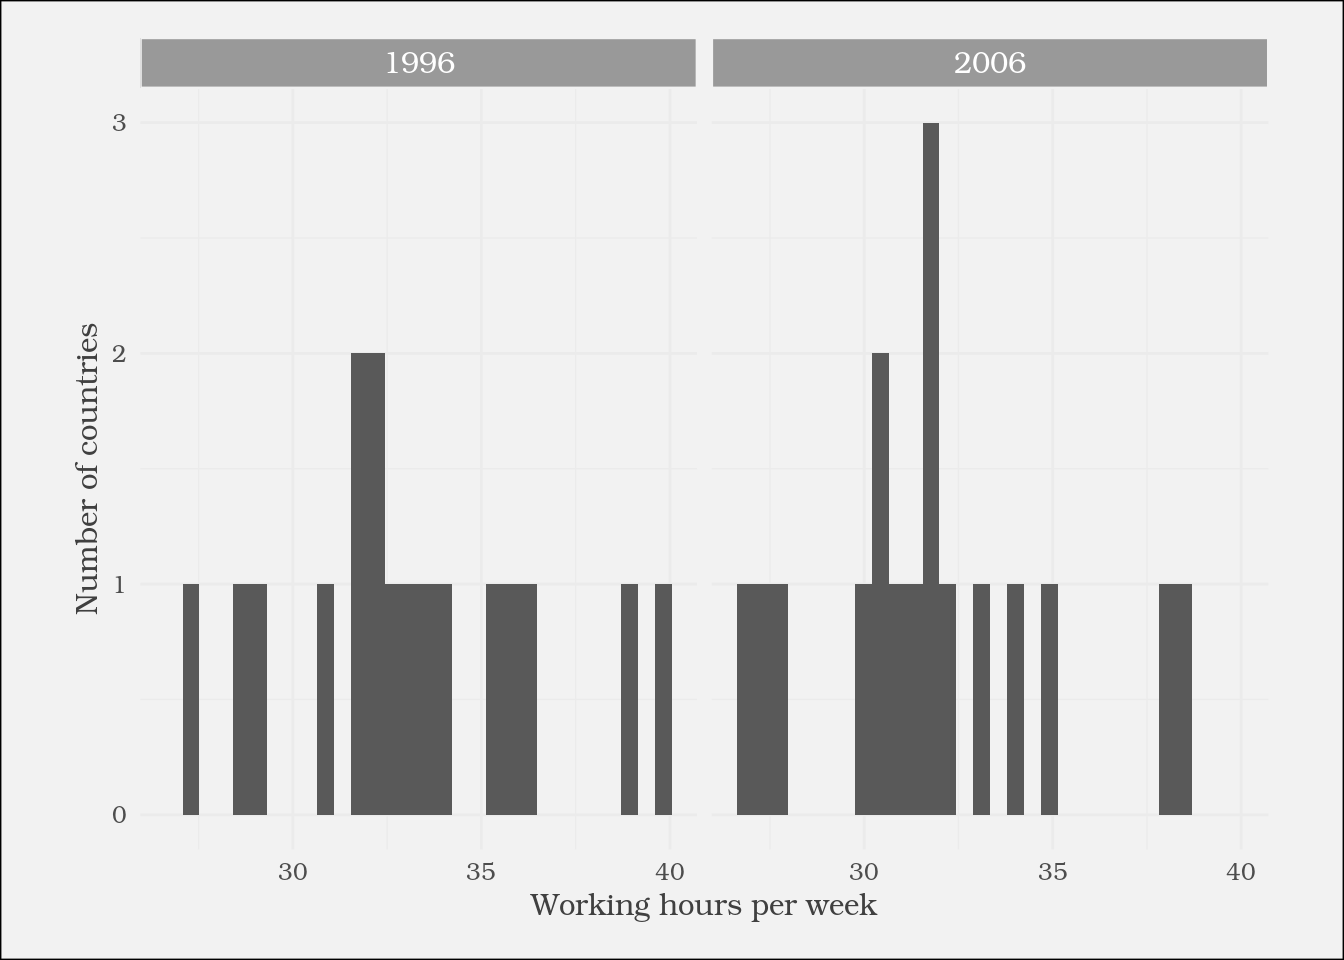
Tùy biến kiểu cho biểu đồ có facets

strip.background
strip.text
...
Truyền đạt bằng Dữ liệu trong Tidyverse

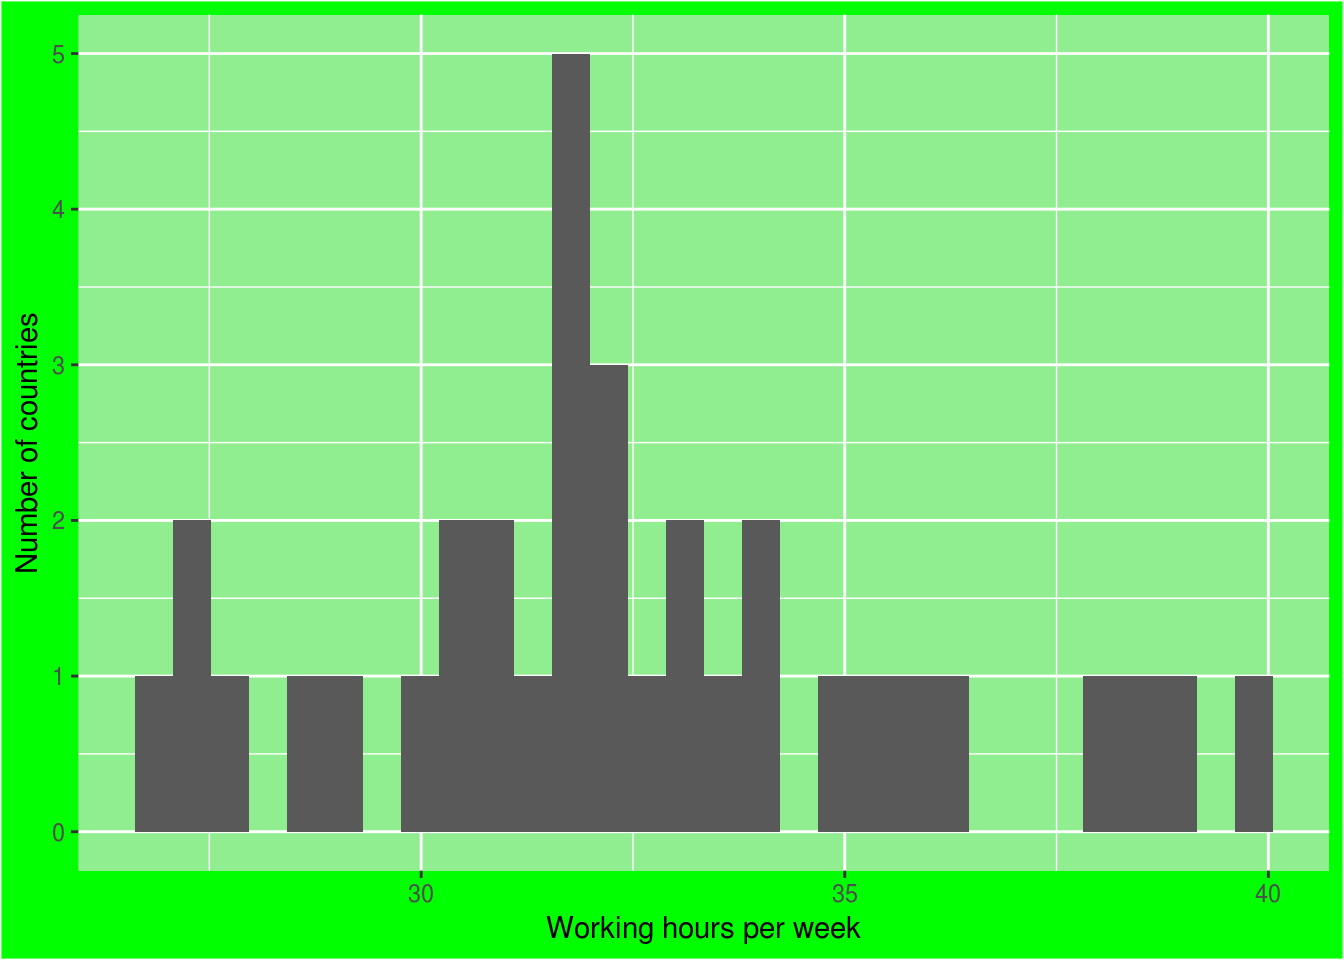
Tự định nghĩa hàm theme của bạn

theme_green <- function(){
  theme(
    plot.background = 
      element_rect(fill = "green"),
    panel.background = 
      element_rect(fill = 
        "lightgreen")
  )}
ggplot(ilo_data) +
  geom_histogram(aes(
    x = working_hours)) +
  labs(x = "Giờ làm việc mỗi tuần",
       y = "Số quốc gia") +

theme_green()

Truyền đạt bằng Dữ liệu trong Tidyverse

Cùng luyện tập nào!

Truyền đạt bằng Dữ liệu trong Tidyverse

Preparing Video For Download...