Lọc và trực quan hóa dữ liệu

Truyền đạt bằng Dữ liệu trong Tidyverse

Timo Grossenbacher

Data Journalist

Lọc dữ liệu cho các nước châu Âu

ilo_data %>%
  filter(country == "Switzerland")
# A tibble: 27 x 4
       country   year hourly_compensation working_hours
         <fct>  <fct>               <dbl>         <dbl>
 1 Switzerland   1980               10.96      34.70385
 2 Switzerland   1981               10.01      34.33462
 3 Switzerland   1982               10.31      34.12308
 4 Switzerland   1983               10.33      33.84231
 5 Switzerland   1984                9.52      33.47885
 6 Switzerland   1985                9.55      33.35961
 7 Switzerland   1986               13.62      33.19615
 8 Switzerland   1987               16.90      33.17308
 9 Switzerland   1988               17.81      33.16269
10 Switzerland   1989               16.54      32.87308
# ... with 17 more rows
Truyền đạt bằng Dữ liệu trong Tidyverse
ilo_data %>% 
  filter(country %in% c("Sweden", "Switzerland"))
# A tibble: 54 x 4
      country   year hourly_compensation working_hours
        <fct>  <fct>               <dbl>         <dbl>
1      Sweden   1980               12.40      29.16923
2 Switzerland   1980               10.96      34.70385
3      Sweden   1981               11.70      29.00769
4 Switzerland   1981               10.01      34.33462
5      Sweden   1982                9.99      29.27885
# ... with 49 more rows

...tương đương với:

ilo_data %>% 
  filter(country == "Sweden" | country == "Switzerland")
Truyền đạt bằng Dữ liệu trong Tidyverse

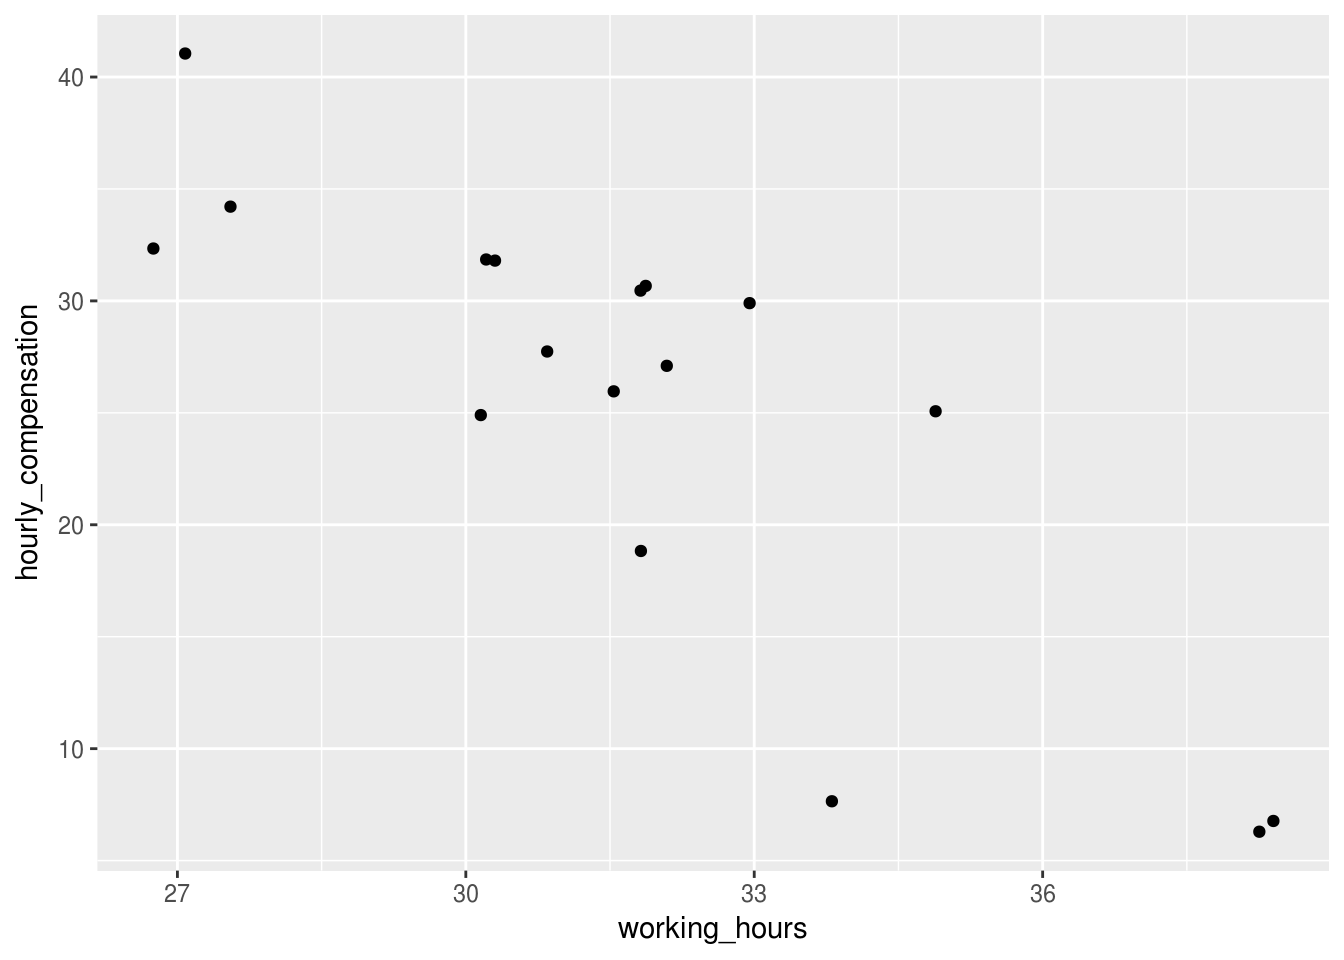
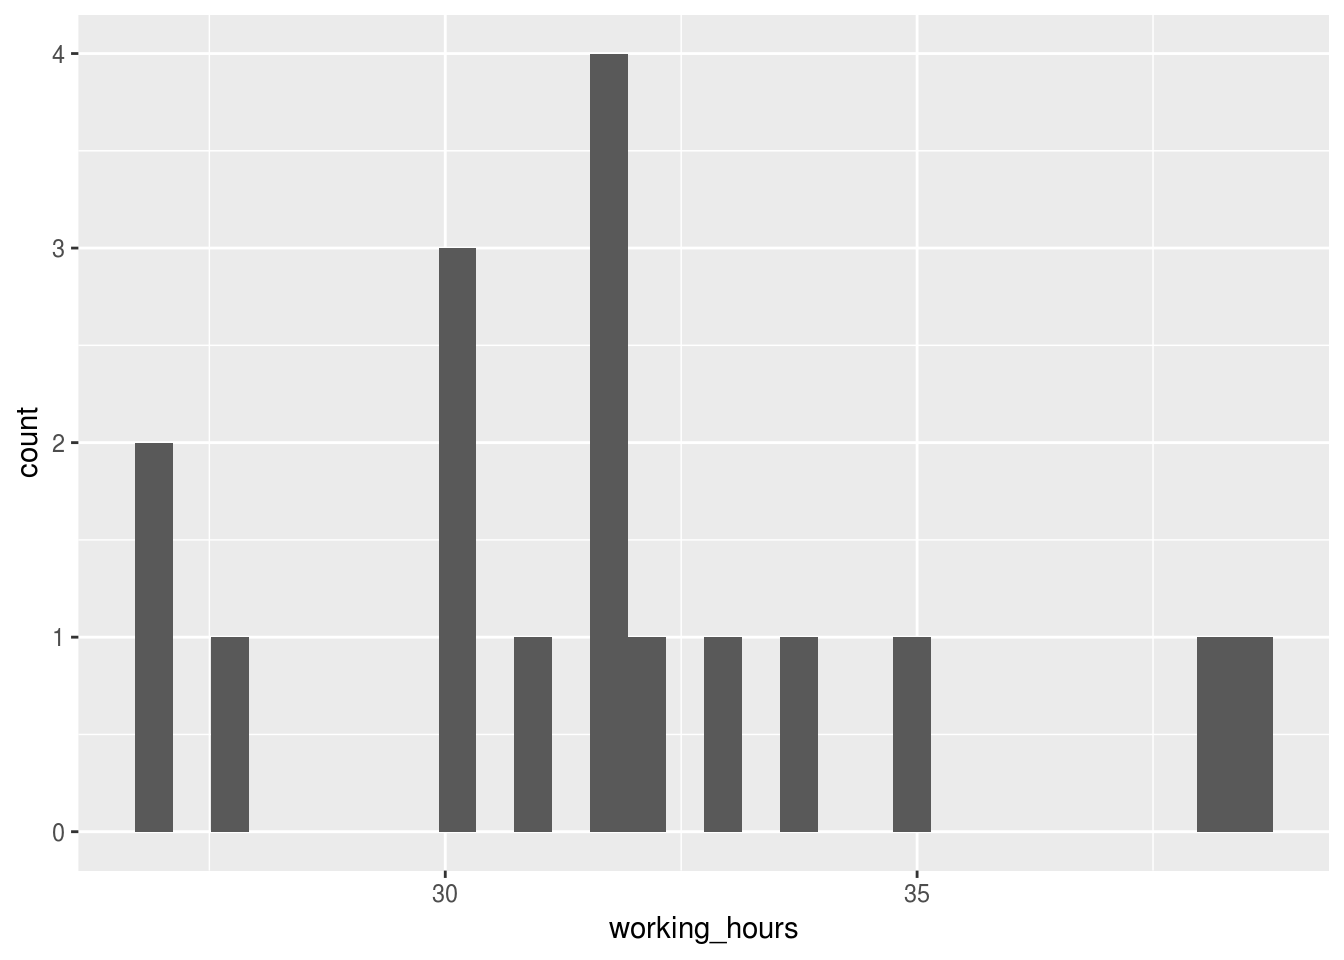
Mối quan hệ giữa hai chỉ báo

plot_data <- 
  ilo_data %>% 
    filter(year == 2006)

ggplot(plot_data) +
  geom_histogram(
    aes(x = working_hours))
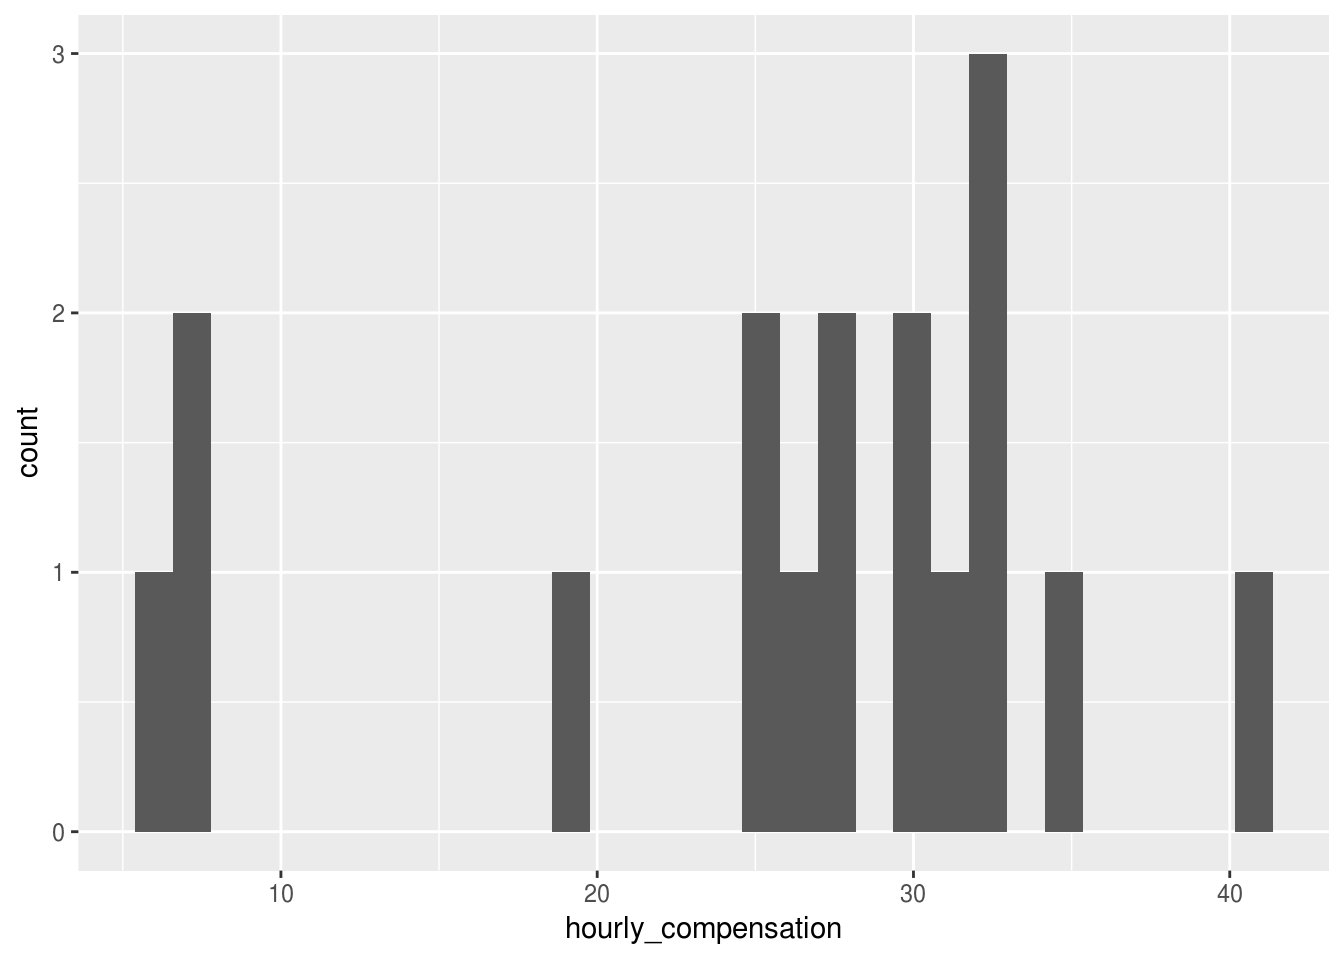
plot_data <- 
  ilo_data %>% 
    filter(year == 2006)

ggplot(plot_data) +
  geom_histogram(
    aes(x = hourly_compensation))
Truyền đạt bằng Dữ liệu trong Tidyverse

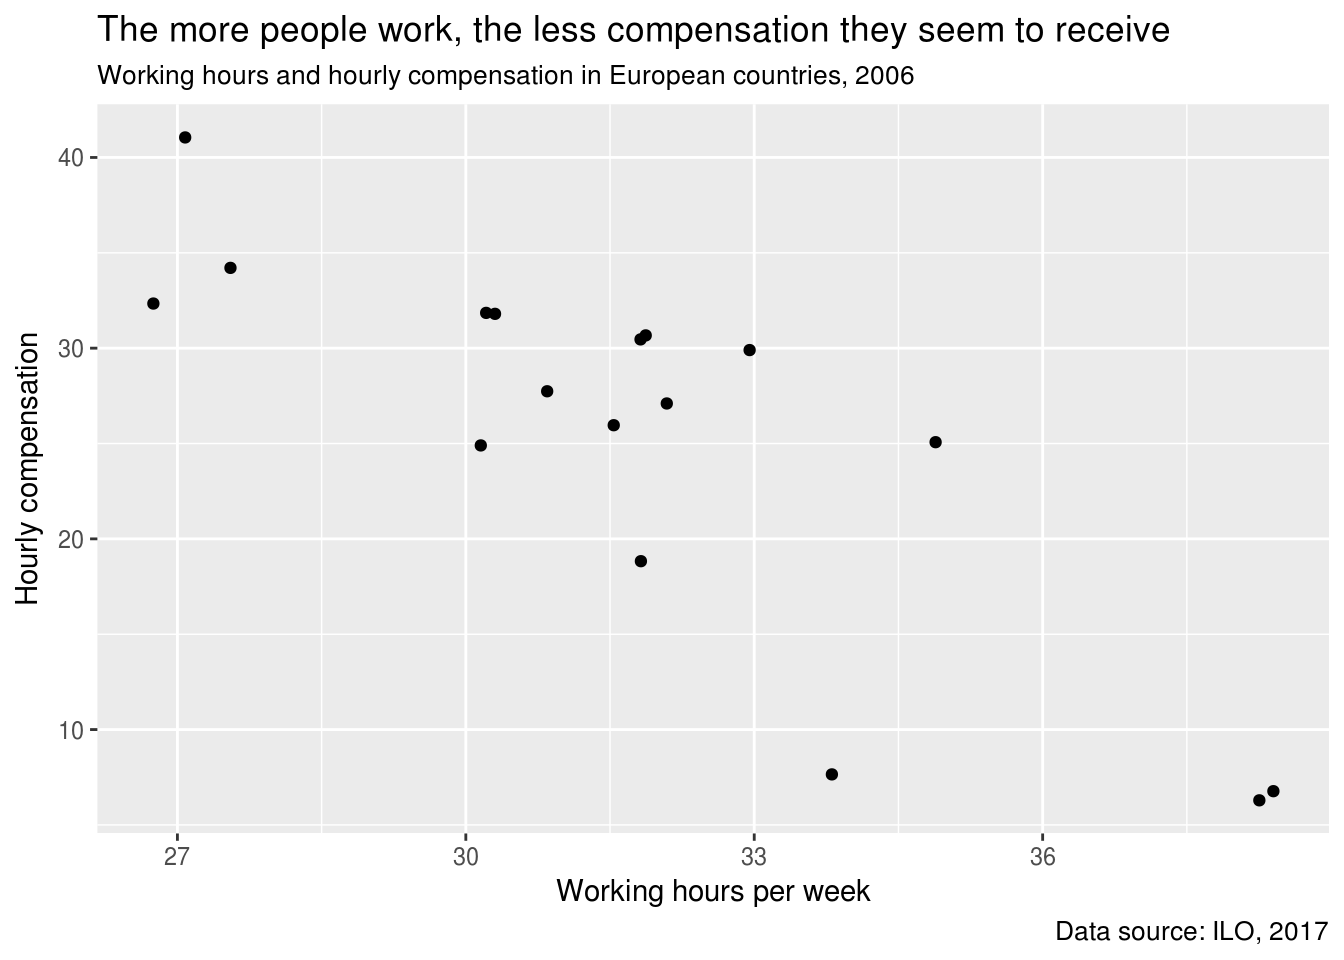
Mối quan hệ giữa hai chỉ báo

Truyền đạt bằng Dữ liệu trong Tidyverse

Thêm nhãn vào biểu đồ

Truyền đạt bằng Dữ liệu trong Tidyverse

Ôn lại một số hàm dplyr

ilo_data %>%
  group_by(country) %>% 
  summarize(median_working_hours = median(working_hours))
# A tibble: 17 x 2
     country median_working_hours
       <fct>                <dbl>
1    Austria             31.69904
2    Belgium             32.03846
3 Czech Rep.             39.10000
4    Finland             34.04808
5     France             32.34615
# ... with 12 more rows
Truyền đạt bằng Dữ liệu trong Tidyverse

Cùng luyện tập nào!

Truyền đạt bằng Dữ liệu trong Tidyverse

Preparing Video For Download...