Vẽ biểu đồ histogram
Tư duy Thống kê với Python (Phần 1)

Justin Bois
Teaching Professor at the California Institute of Technology
Kết quả bầu cử bang dao động Mỹ 2008
Dữ liệu lấy từ Data.gov (https://www.data.gov/)
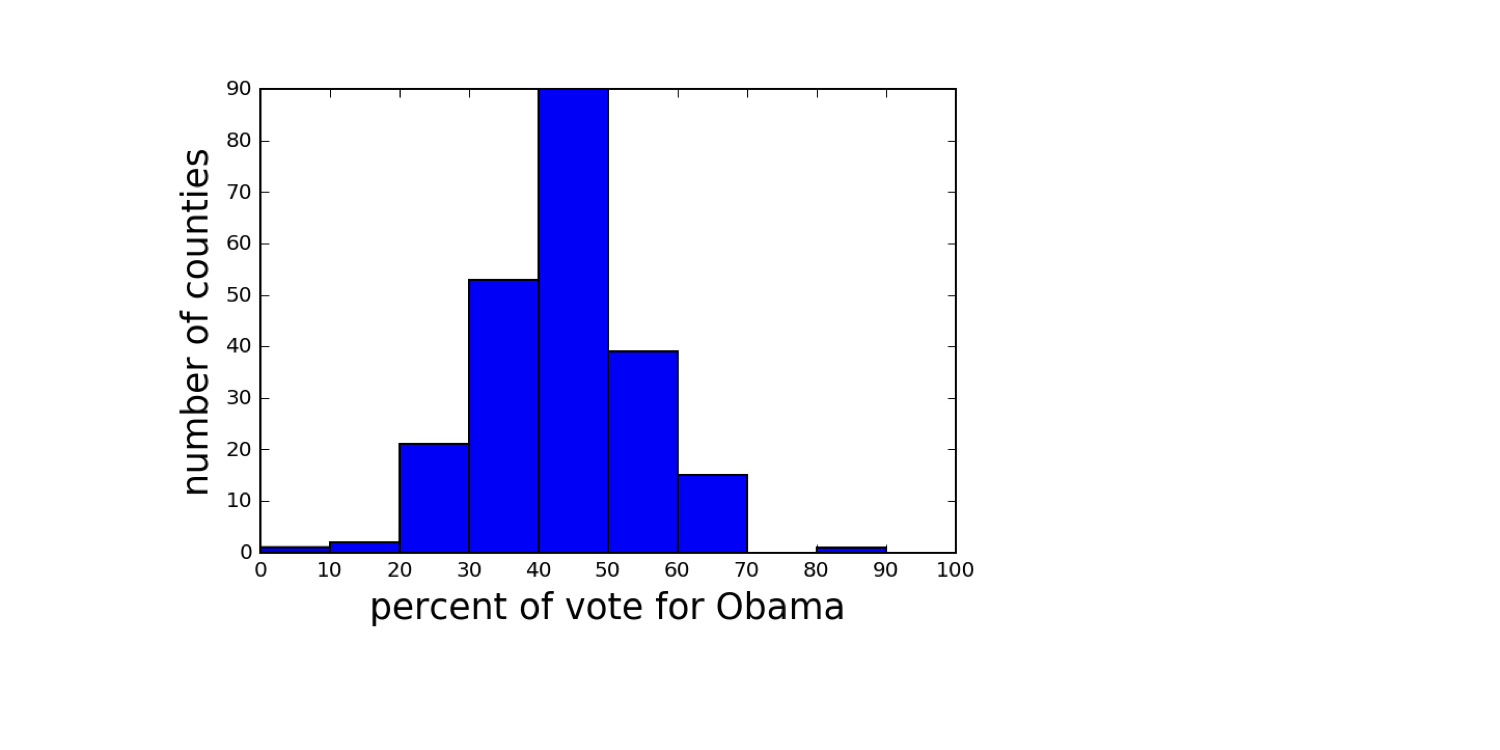
Kết quả bầu cử bang dao động Mỹ 2008
Dữ liệu lấy từ Data.gov (https://www.data.gov/)
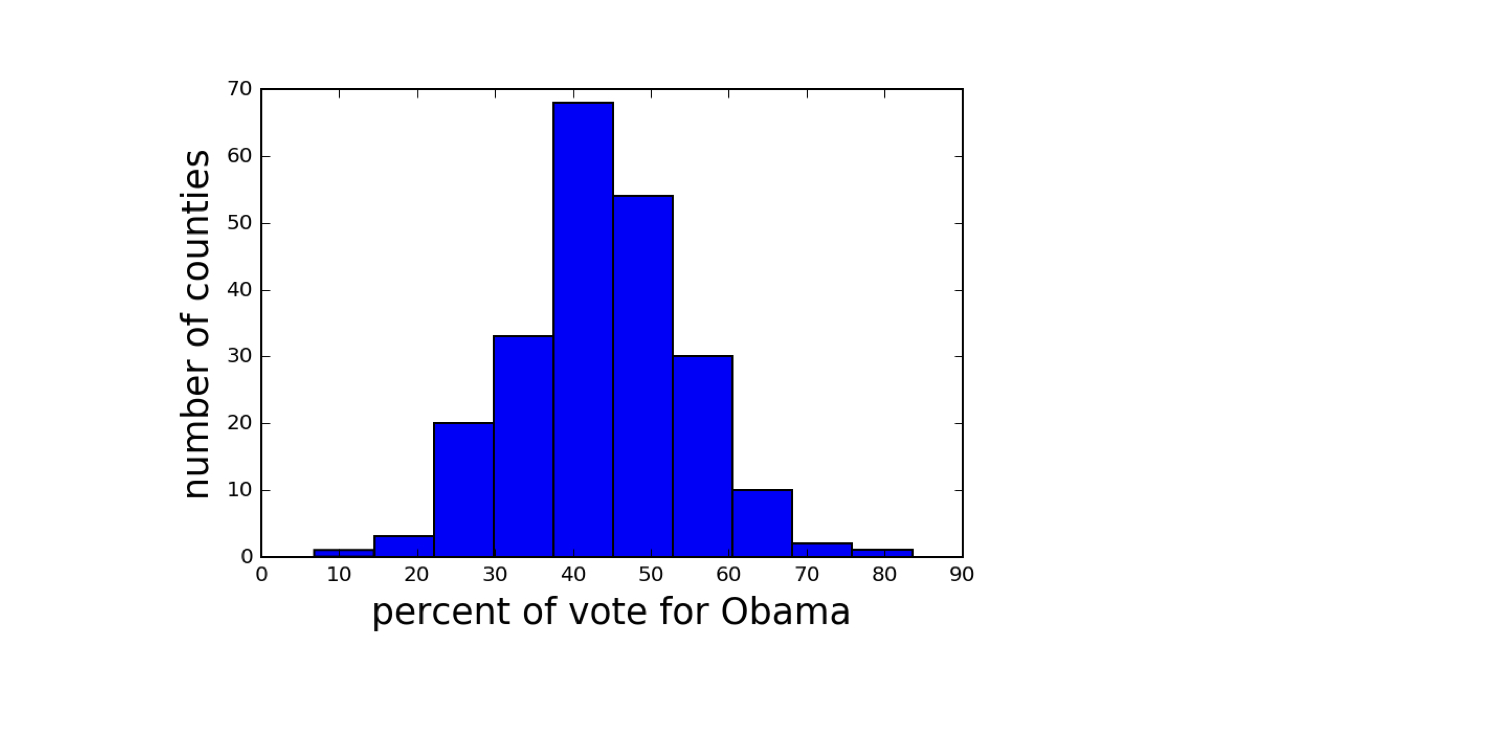
Histogram với cách chia bin khác nhau
Dữ liệu lấy từ Data.gov (https://www.data.gov/)
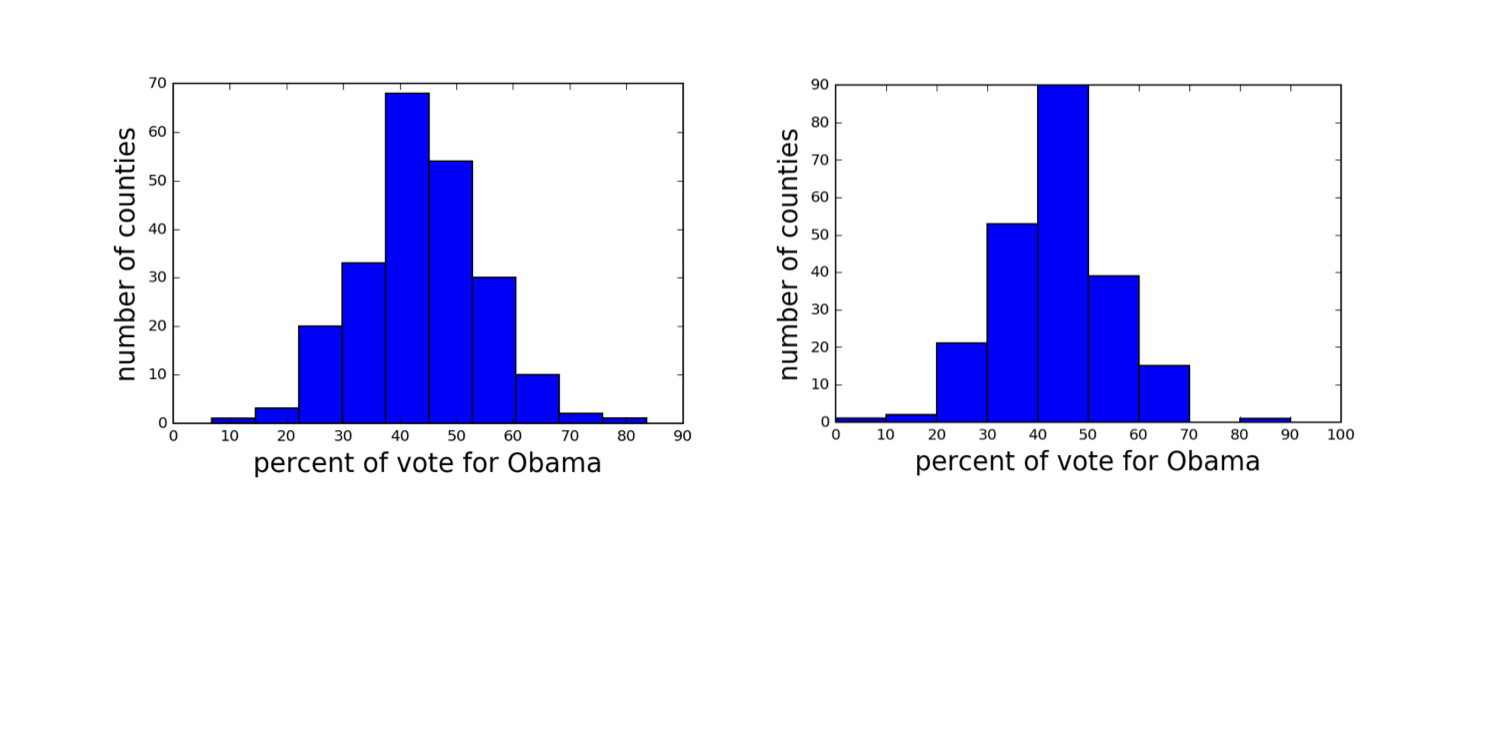
Thiết lập số bin của histogram
bin_edges = [0, 10, 20, 30, 40, 50,
                60, 70, 80, 90, 100]
_ = plt.hist(df_swing['dem_share'], bins=bin_edges)
plt.show()
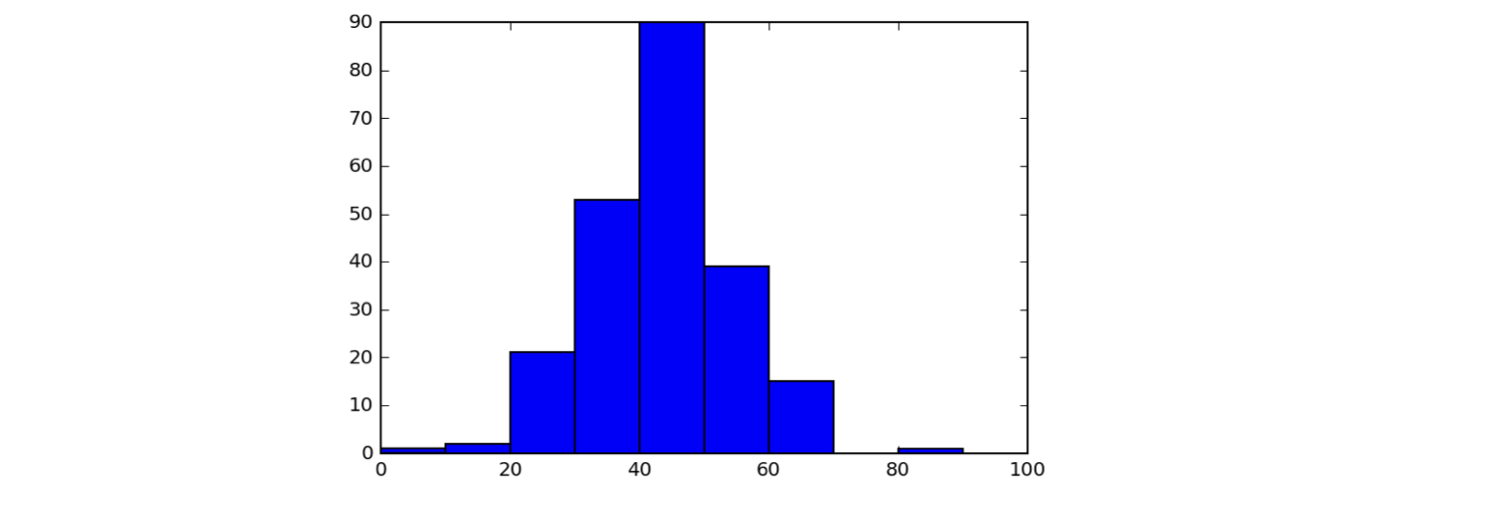
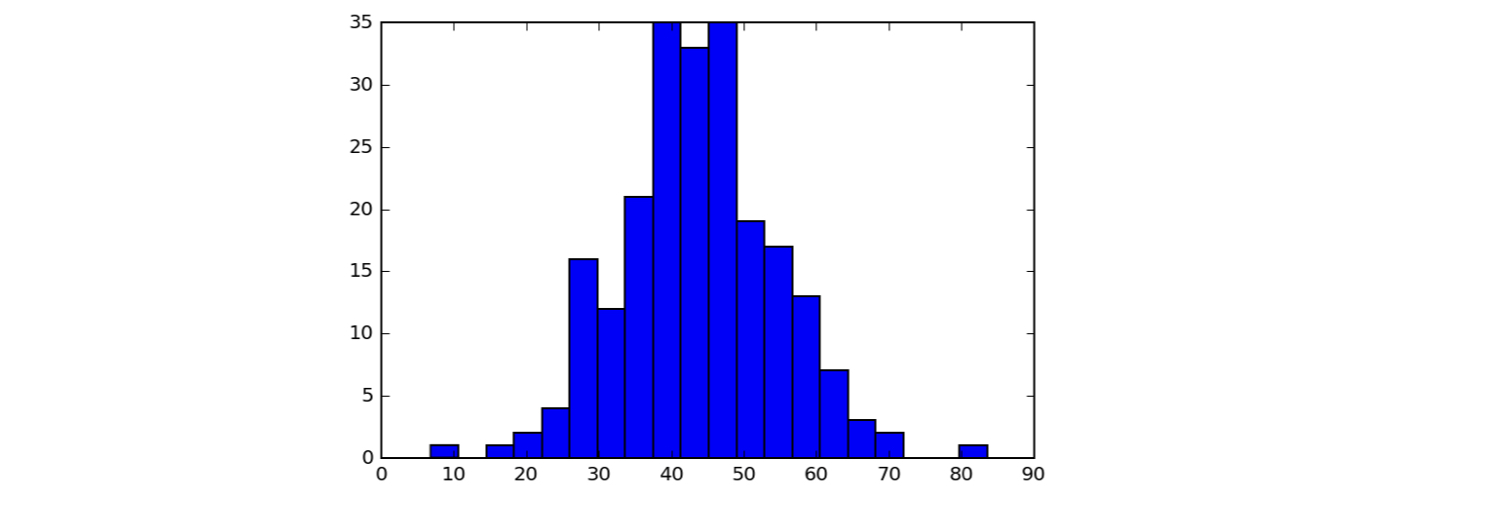
Thiết lập số bin của histogram
_ = plt.hist(df_swing['dem_share'], bins=20)
plt.show()
Histogram theo kiểu Seaborn
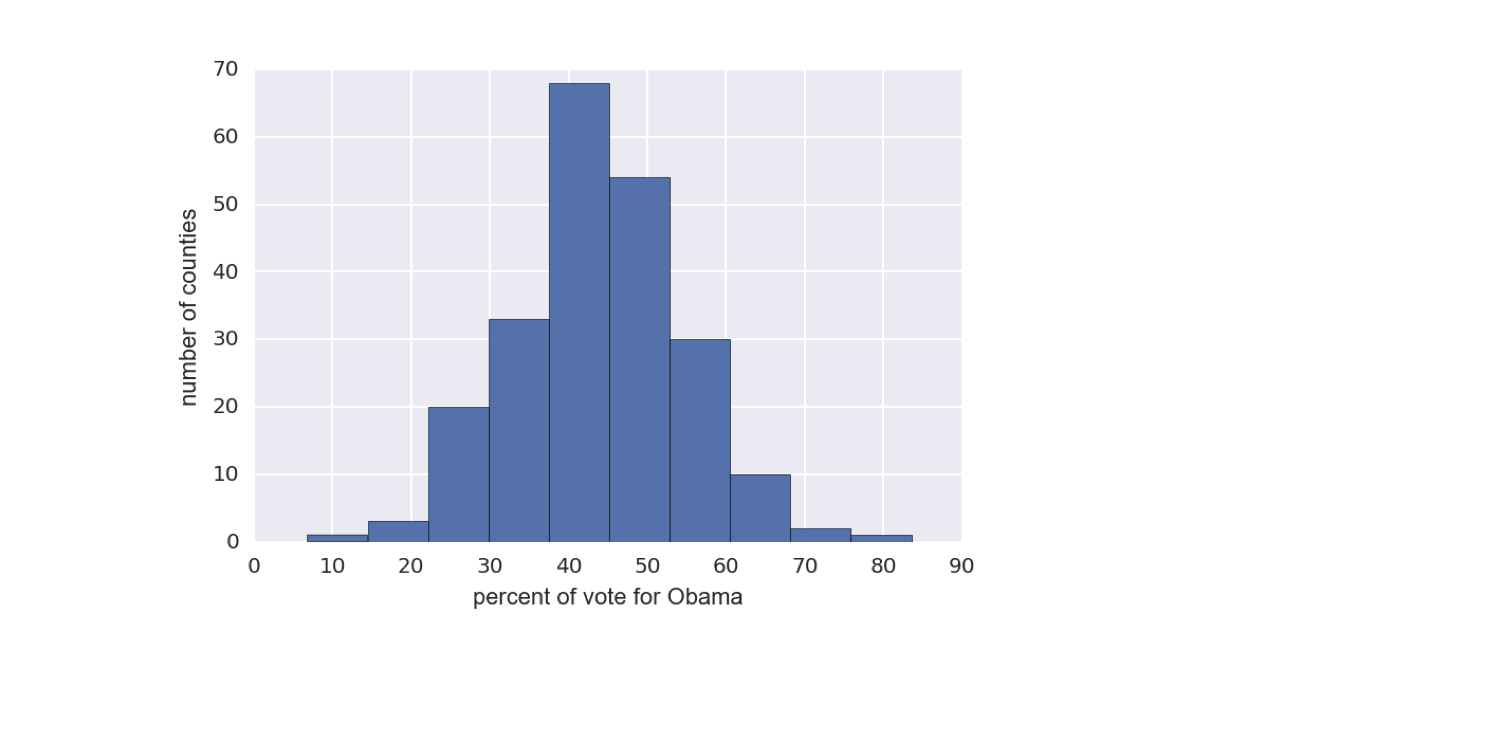
1 Dữ liệu lấy từ Data.gov (https://www.data.gov/)

