Biểu đồ và figure Plotly
Xây dựng Dashboard với Dash và Plotly

Alex Scriven
Data Scientist
Plotly và Dash
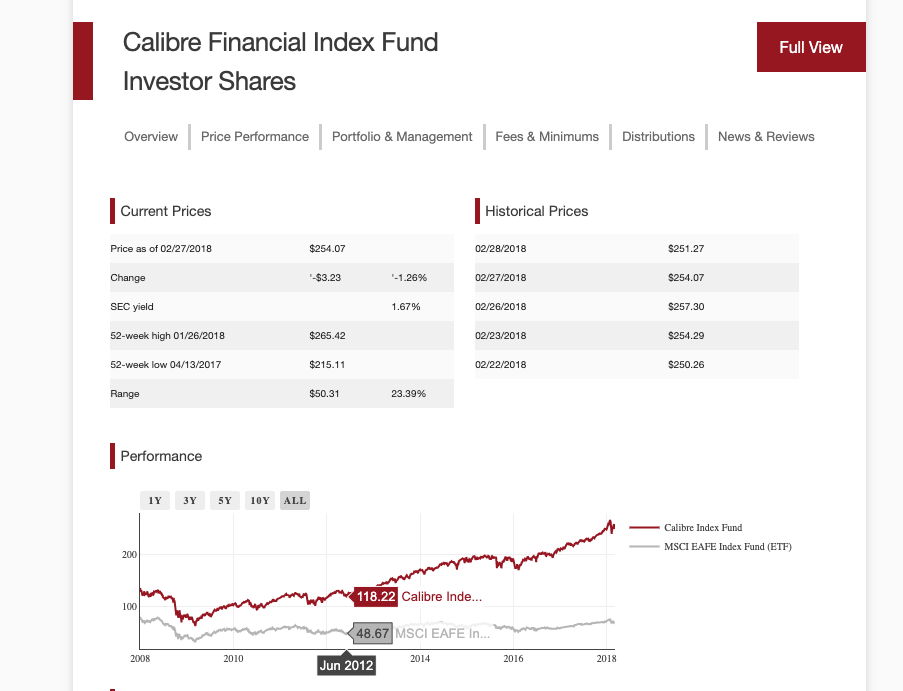
Dữ liệu e-commerce của chúng ta

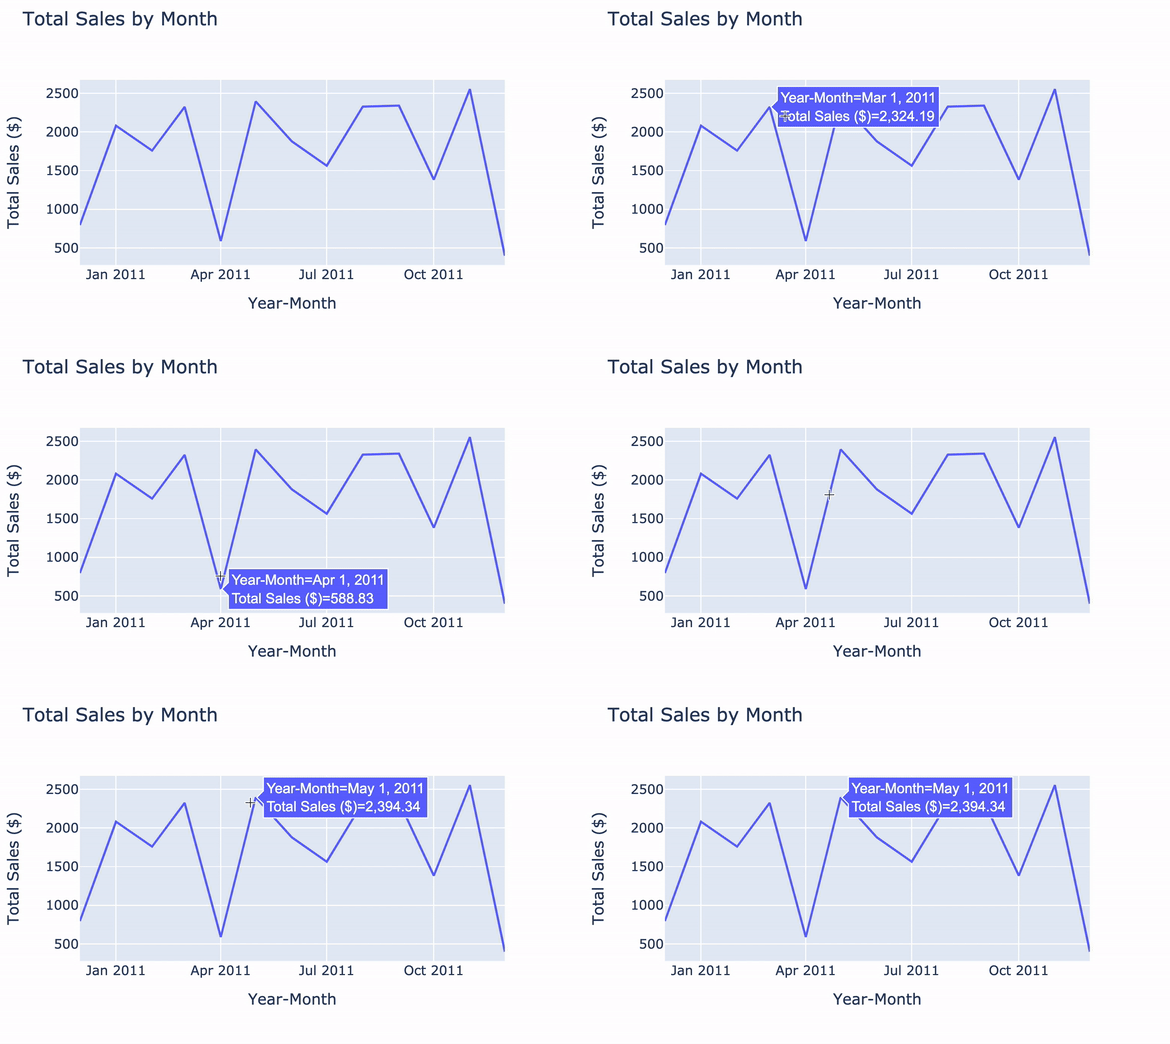
Biểu đồ đường với plotly.express
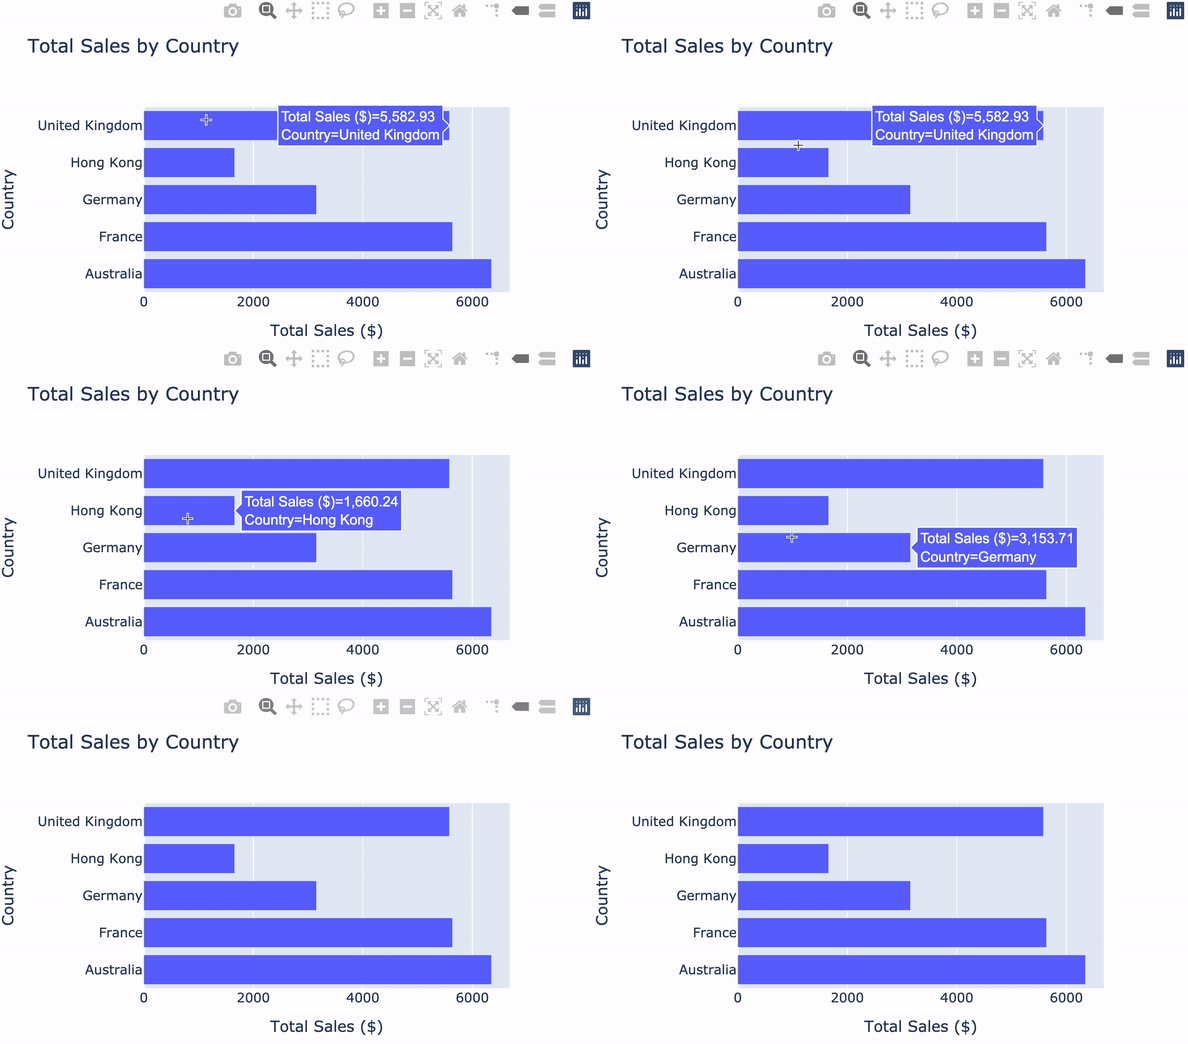
Biểu đồ cột với plotly.express
Tùy chỉnh biểu đồ Plotly

Xây dựng Dashboard với Dash và Plotly
Alex Scriven
Data Scientist

