So sánh metric và biểu đồ trong DVC

CI/CD cho Machine Learning

Ravi Bhadauria

Machine Learning Engineer

Cấu hình file DVC YAML

  • Cấu hình file DVC YAML để theo dõi metric qua các thí nghiệm
  • Đổi từ outs
stages:
  preprocess:
    ...
  train:
    ...
    outs:
    - metrics.json
    - confusion_matrix.png
  • Sang metrics
stages:
  preprocess:
    ...
  train:
    ...
    outs:
    - confusion_matrix.png

metrics: - metrics.json: cache: false
CI/CD cho Machine Learning

Truy vấn và so sánh metric trong DVC

-> dvc metrics show

Path accuracy f1_score precision recall metrics.json 0.947 0.8656 0.988 0.7702

Thay đổi một siêu tham số và chạy lại dvc repro

-> dvc metrics diff

Path Metric HEAD workspace Change metrics.json accuracy 0.947 0.9995 0.0525 metrics.json f1_score 0.8656 0.9989 0.1333 metrics.json precision 0.988 0.9993 0.0113 metrics.json recall 0.7702 0.9986 0.2284
1 https://dvc.org/doc/command-reference/metrics
CI/CD cho Machine Learning

Thiết lập DVC GitHub Action

  • Thêm GitHub Action setup-dvc
  • Thay chạy script Python bằng pipeline DVC
steps:
  ...
  - name: Setup DVC
    uses: iterative/setup-dvc@v1

- name: Run DVC pipeline run: dvc repro
CI/CD cho Machine Learning

Thiết lập DVC GitHub Action

- name: Write CML report
  env:
    REPO_TOKEN: ${{ secrets.GITHUB_TOKEN }}
  run: |
    # In các metric của nhánh hiện tại
    dvc metrics show --md >> report.md

# So sánh metric với nhánh main git fetch --prune dvc metrics diff --md main >> report.md
# Tạo báo cáo CML cml comment create report.md
CI/CD cho Machine Learning

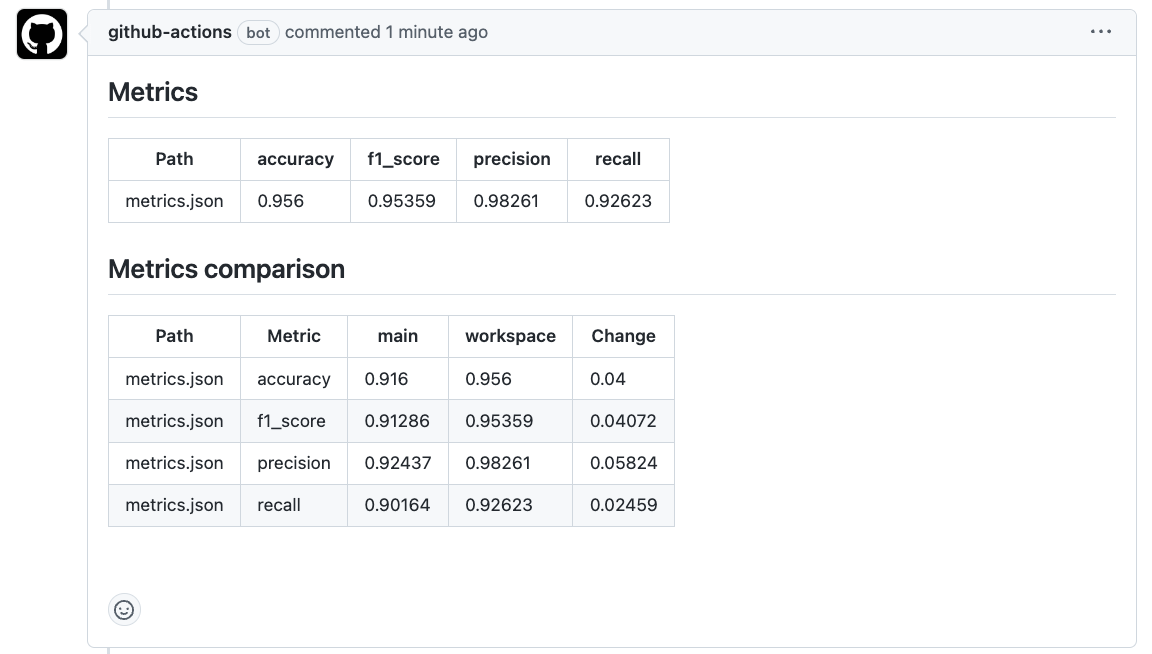
Pipeline đang chạy

Ảnh chụp bình luận pull request hiển thị chênh lệch metric so với nhánh main

CI/CD cho Machine Learning

Các loại biểu đồ trong DVC

  • scatter - biểu đồ phân tán
  • linear - biểu đồ tuyến tính tương tác
  • simple - biểu đồ tuyến tính tùy chỉnh, không tương tác
  • smooth - biểu đồ tuyến tính có làm mượt
  • confusion - ma trận nhầm lẫn
  • confusion_normalized - ma trận nhầm lẫn chuẩn hóa về khoảng <0, 1>
  • bar_horizontal - biểu đồ thanh ngang
  • bar_horizontal_sorted - biểu đồ thanh ngang sắp theo độ dài thanh
1 https://dvc.org/doc/user-guide/experiment-management/visualizing-plots#plot-templates-data-series-only
CI/CD cho Machine Learning

Cấu hình DVC YAML cho biểu đồ

stages:
  train:
    ...
    plots:
    - predictions.csv: # Tên file chứa dự đoán
        template: confusion # Kiểu biểu đồ

x: predicted_label # Cột trục X trong file csv y: true_label # Cột trục Y trong file csv x_label: 'Predicted label' y_label: 'True label' title: Confusion matrix
cache: false # Lưu vào Git
CI/CD cho Machine Learning

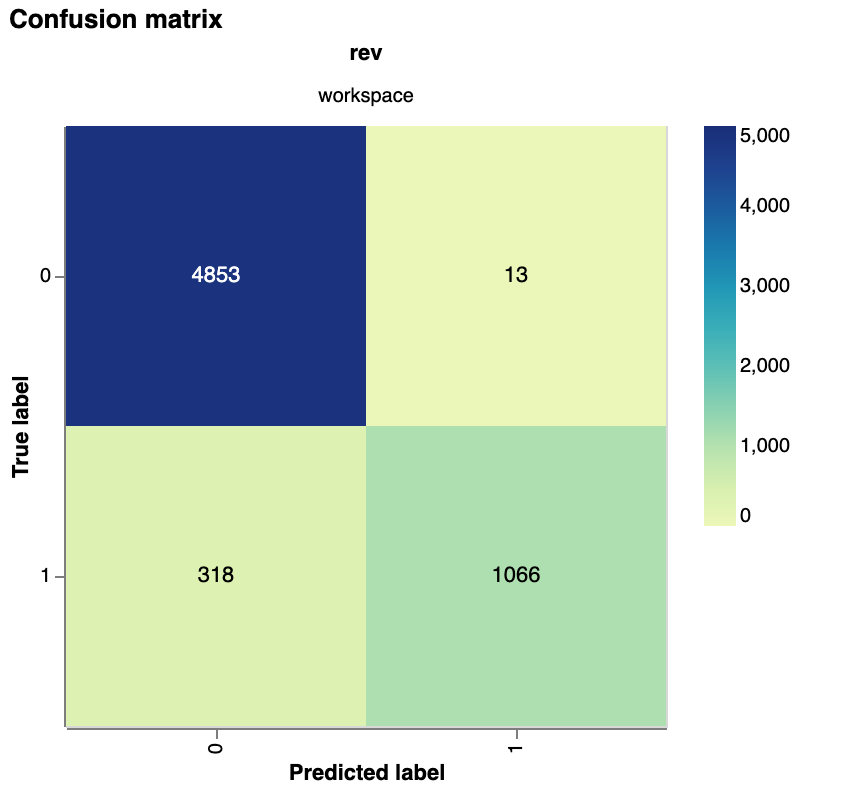
Vẽ Ma trận nhầm lẫn

-> dvc plots show predictions.csv
file:///path/to/index.html

Biểu đồ ma trận nhầm lẫn do DVC tạo

CI/CD cho Machine Learning

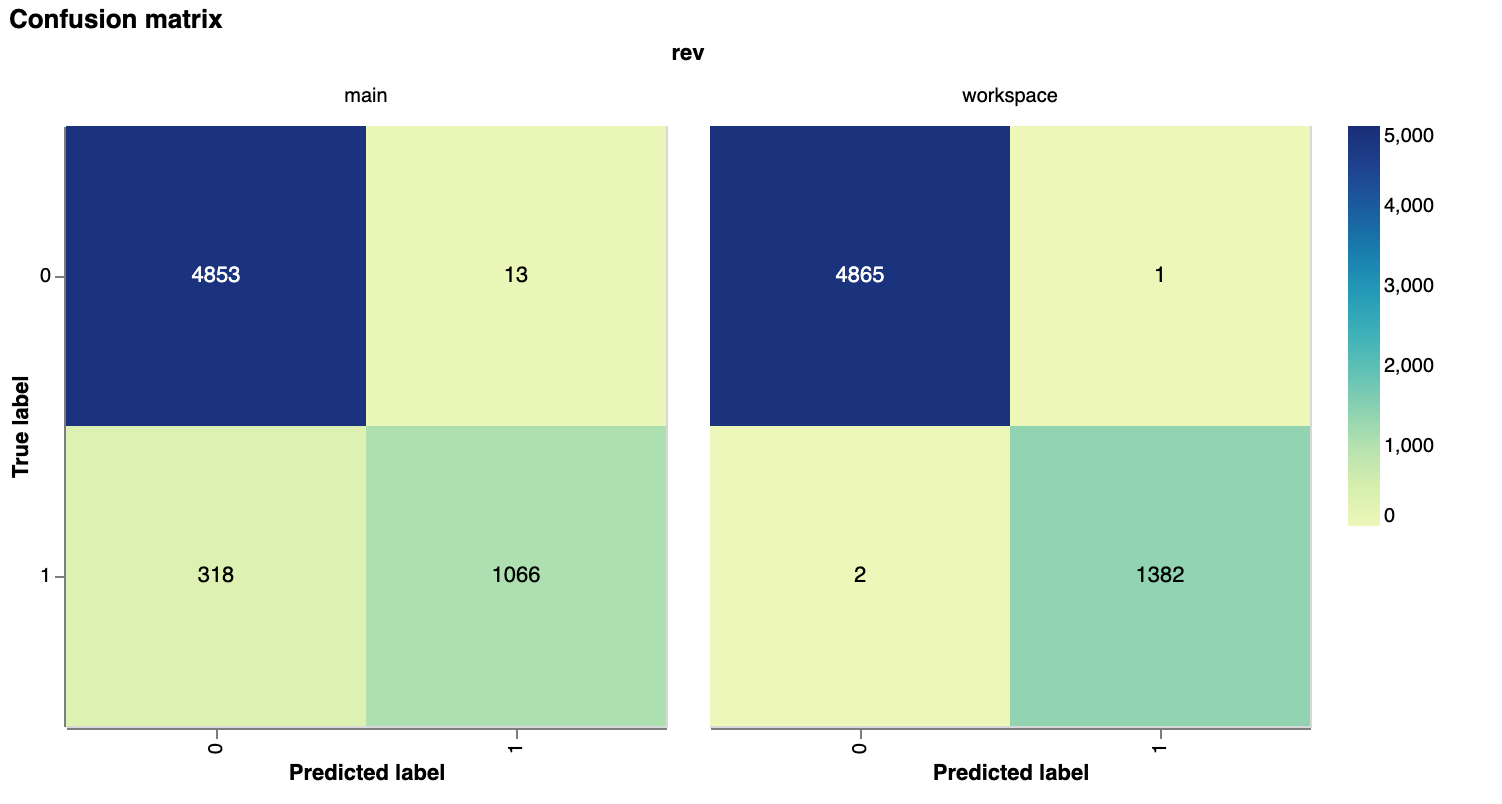
So sánh Ma trận nhầm lẫn

-> dvc plots diff --target predictions.csv main
file:///path/to/index.html

Biểu đồ so sánh ma trận nhầm lẫn do DVC tạo

CI/CD cho Machine Learning

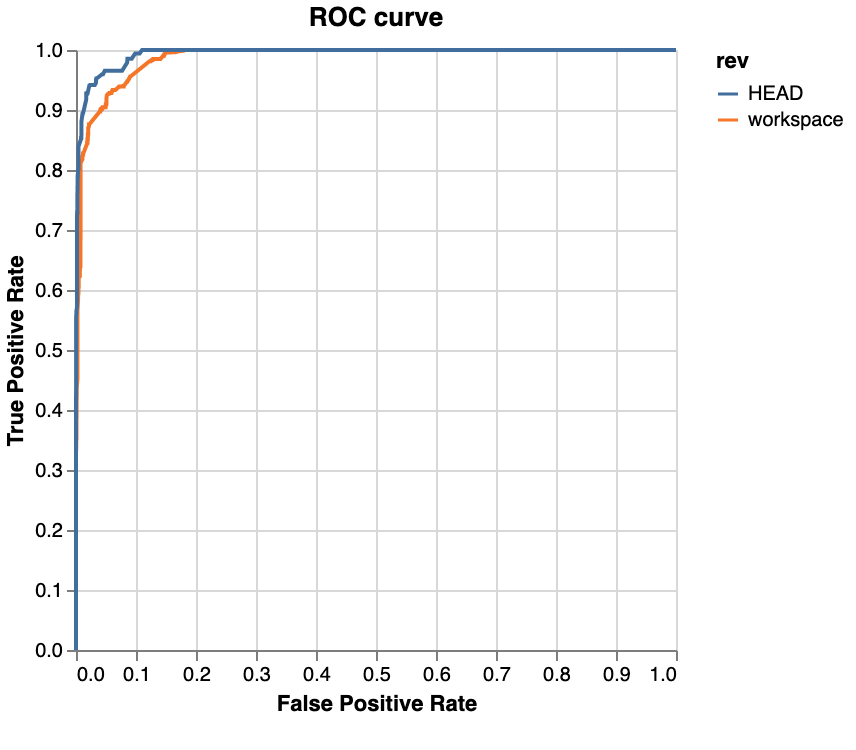
So sánh đường cong ROC

# Thay đổi trong Python
y_proba = model.predict_proba(X_test)
fpr, tpr, _ = roc_curve(y_test, 
                        y_proba[:, 1])
# Thay đổi trong dvc.yaml
plots:
- roc_curve.csv:
    template: simple
    x: fpr
    y: tpr
    x_label: 'False Positive Rate'
    y_label: 'True Positive Rate'
    title: ROC curve
    cache: false

Biểu đồ so sánh đường cong ROC do DVC tạo

CI/CD cho Machine Learning

Ayo berlatih!

CI/CD cho Machine Learning

Preparing Video For Download...