Diễn giải kết quả và so sánh mô hình

Phân tích dữ liệu Bayesian với Python

Michal Oleszak

Machine Learning Engineer

Chạy lại mô hình

formula = "num_clicks ~ clothes_banners_shown + sneakers_banners_shown"

with pm.Model() as model_1:
    pm.GLM.from_formula(formula, data=ads_aggregated)
    trace_1 = pm.sample(draws=1000, tune=500)
Phân tích dữ liệu Bayesian với Python

Chạy lại mô hình

formula = "num_clicks ~ clothes_banners_shown + sneakers_banners_shown"

with pm.Model() as model_1:
    pm.GLM.from_formula(formula, data=ads_aggregated)
    trace_1 = pm.sample(draws=1000, tune=500, chains=4)
  • Số tham số: 4
  • Số lượt rút cho mỗi tham số: 1000 $\times$ 4 = 4000
Phân tích dữ liệu Bayesian với Python

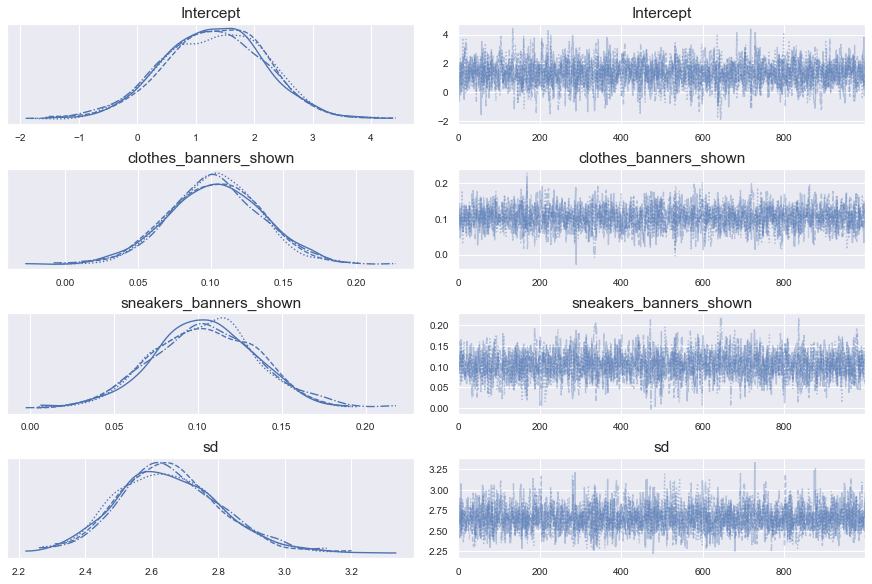
Biểu đồ trace

pm.traceplot(trace_1)

Lưới 8 biểu đồ: hai cột, bốn hàng. Cột trái là bốn biểu đồ mật độ, cột phải là bốn biểu đồ đường, mỗi biểu đồ cho một tham số.

Phân tích dữ liệu Bayesian với Python

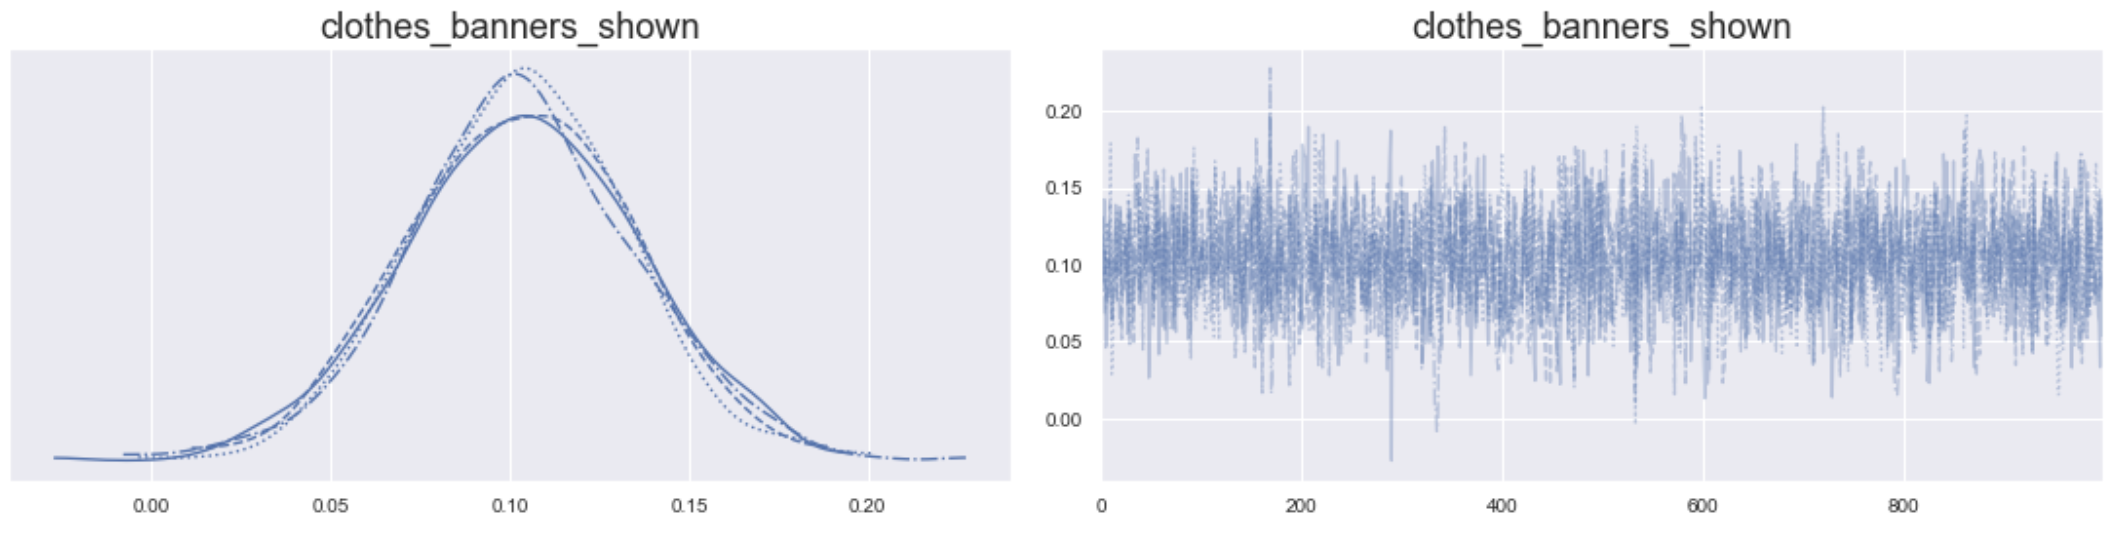
Biểu đồ trace: phóng to một tham số


Hai biểu đồ cạnh nhau: trái là mật độ, phải là đường các lượt rút của một tham số.

Phân tích dữ liệu Bayesian với Python

Biểu đồ forest

pm.forestplot(trace_1)
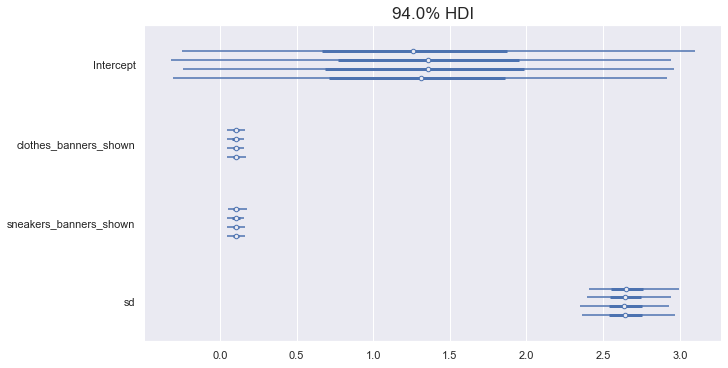
Biểu đồ hiển thị phân phối các lượt rút cho mỗi tham số dưới dạng đường ngang.

Phân tích dữ liệu Bayesian với Python

Tóm tắt trace

pm.summary(trace_1)
                         mean     sd  hdi_3%  hdi_97%  mcse_mean  mcse_sd  \
Intercept               1.307  0.886  -0.305    2.962      0.018    0.013   
clothes_banners_shown   0.103  0.031   0.043    0.160      0.001    0.000   
sneakers_banners_shown  0.104  0.032   0.045    0.163      0.001    0.001   
sd                      2.654  0.157   2.382    2.970      0.003    0.002   

                        ess_mean  ess_sd  ess_bulk  ess_tail  r_hat  
Intercept                 2346.0  2318.0    2351.0    2083.0    1.0  
clothes_banners_shown     2085.0  2085.0    2089.0    1868.0    1.0  
sneakers_banners_shown    2105.0  1953.0    2122.0    1869.0    1.0  
sd                        2615.0  2590.0    2646.0    1834.0    1.0
Phân tích dữ liệu Bayesian với Python

Huấn luyện mô hình khác

formula = "num_clicks ~ clothes_banners_shown + sneakers_banners_shown + weekend"

with pm.Model() as model_2:
    pm.GLM.from_formula(formula, data=ads_aggregated)
    trace_2 = pm.sample(draws=1000, tune=500)
Phân tích dữ liệu Bayesian với Python

Tiêu chí thông tin WAIC

comparison = pm.compare({"trace_1": trace_1, "trace_2": trace_2}, 
                        ic="waic", scale="deviance")
print(comparison)
        rank     waic   p_waic    d_waic    weight       se      dse warning  \
trace_2    0   -362.8   5.1576         0  0.513792  9.37269        0    True   
trace_1    1 -362.926  4.13318  0.126236  0.486208  9.48352  1.50682    True   

        waic_scale  
trace_2        log  
trace_1        log
Phân tích dữ liệu Bayesian với Python

Biểu đồ so sánh

pm.compareplot(comparison)
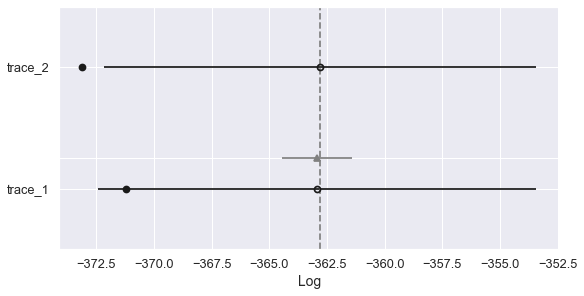
Biểu đồ trực quan hóa giá trị WAIC cho hai mô hình.

Phân tích dữ liệu Bayesian với Python

Hãy luyện tập so sánh mô hình!

Phân tích dữ liệu Bayesian với Python

Preparing Video For Download...