The Limits of Prediction

Nhập môn Mô hình tuyến tính với Python

Jason Vestuto

Data Scientist

Interpolation
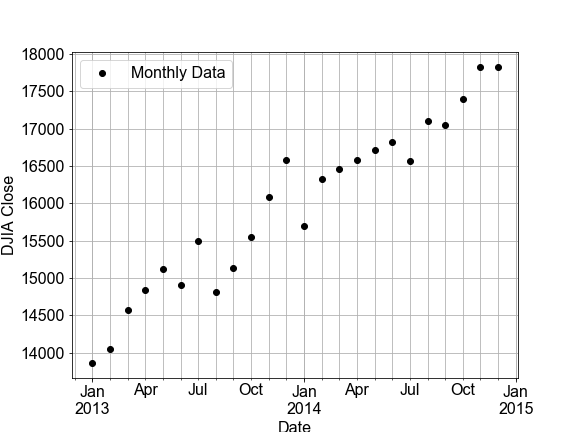
Scatter plot of monthly Dow Jones price index versus dates from 2013 to 2015

Nhập môn Mô hình tuyến tính với Python

Interpolation

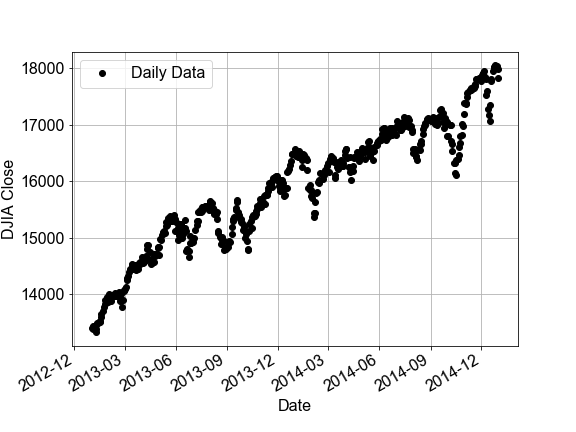
Scatter plot of daily Dow Jones price index versus dates from 2013 to 2015

Nhập môn Mô hình tuyến tính với Python

Interpolation

Scatter plot of monthly Dow Jones price index versus dates from 2013 to 2015

Nhập môn Mô hình tuyến tính với Python

Interpolation

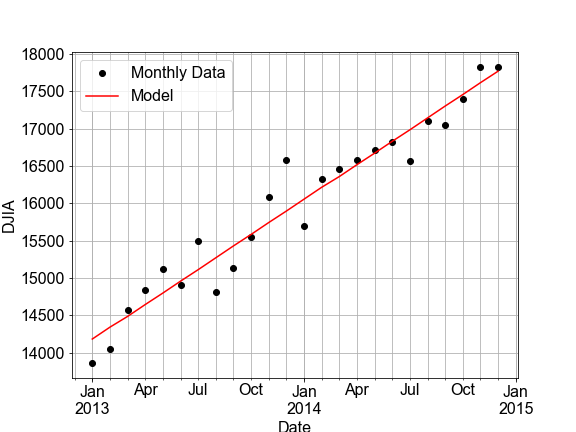
Scatter plot of monthly Dow Jones price index versus dates from 2013 to 2015, with model line over-plotted in red, fitting the data reasonably well

Nhập môn Mô hình tuyến tính với Python

Interpolation

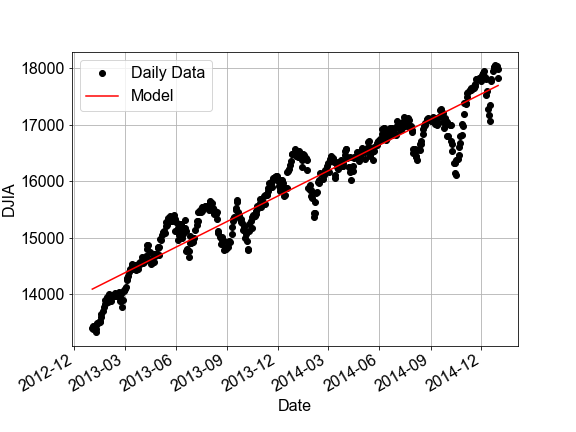
Scatter plot of daily Dow Jones price index versus dates from 2013 to 2015, with model line over-plotted in red, fitting the data only in a few limited ranges of dates

Nhập môn Mô hình tuyến tính với Python

Domain of Validity

  • zoom in: data looks linear
  • model assumption: a2*x**2 + a3*x**3 + ... = zero.
  • build a linear model: a0 + a1*x
  • zoom out: your model breaks
Nhập môn Mô hình tuyến tính với Python

Extrapolating Too Far

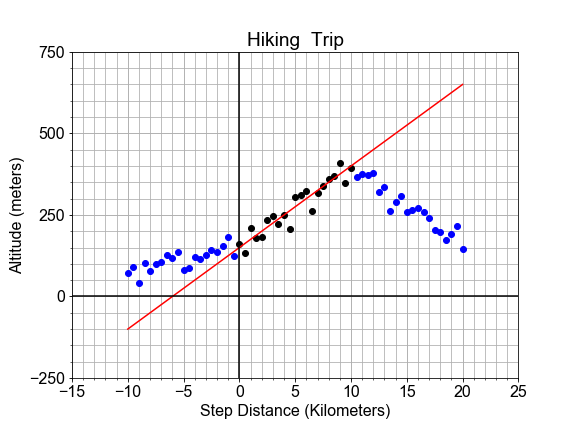
Scatter plot of altitude versus distance, with black points following a linear trend and points extending to each side deviating strongly from linear shown in blue, all with model line over-plot and fitting only the central black points

Nhập môn Mô hình tuyến tính với Python

Let's practice!

Nhập môn Mô hình tuyến tính với Python

Preparing Video For Download...