Model Optimization

Nhập môn Mô hình tuyến tính với Python

Jason Vestuto

Data Scientist

Residuals

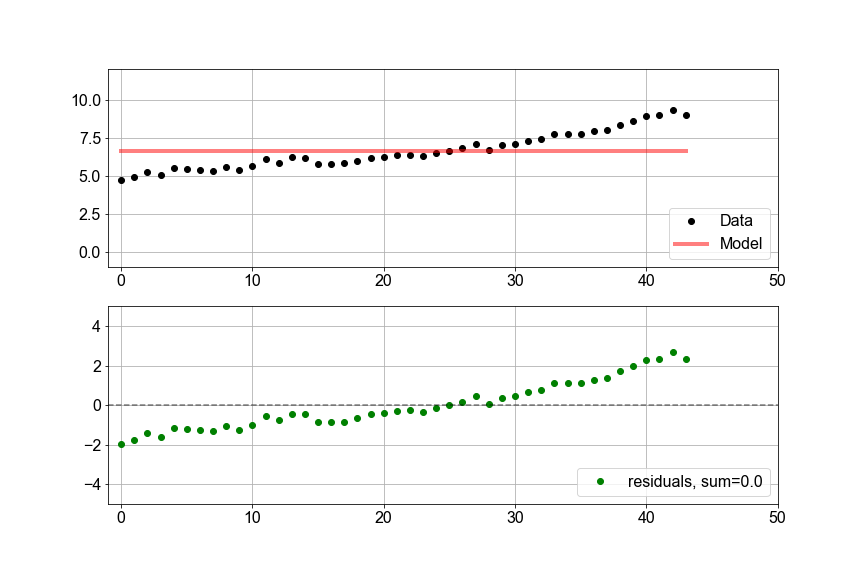
2 panel figure, top plot scatter of sea level versus time and line plot of model, then bottom plot of residuals, showing difference between data and model from the top plot


residuals = y_model - y_data
len(residuals) == len(y_data)
True
Nhập môn Mô hình tuyến tính với Python

Residuals Summed

2 panel figure, top plot scatter of sea level versus time and line plot of model, then bottom plot of residuals, showing difference between data and model from the top plot


residuals = y_model - y_data
print(np.sum(residuals))
0.0
Nhập môn Mô hình tuyến tính với Python

Residuals Squared

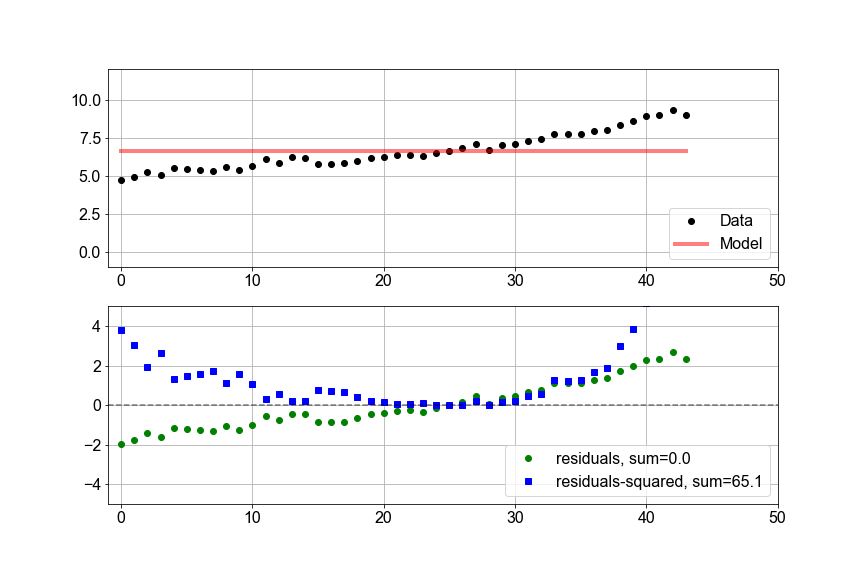
2 panel figure, top plot scatter of sea level versus time and line plot of a poor model of constant value, then bottom plot of residuals as green dot markers and squared residuals as blue square markers

residuals_squared = np.square(y_model - y_data)
print(np.sum(residuals_squared))
65.1
Nhập môn Mô hình tuyến tính với Python

RSS

2 panel figure, top plot scatter of sea level versus time and line plot of a poor model of constant value, then bottom plot of residuals as green dot markers and squared residuals as blue square markers


resid_squared = np.square(y_model - y_data)
RSS = np.sum(resid_squared)
Nhập môn Mô hình tuyến tính với Python

RSS

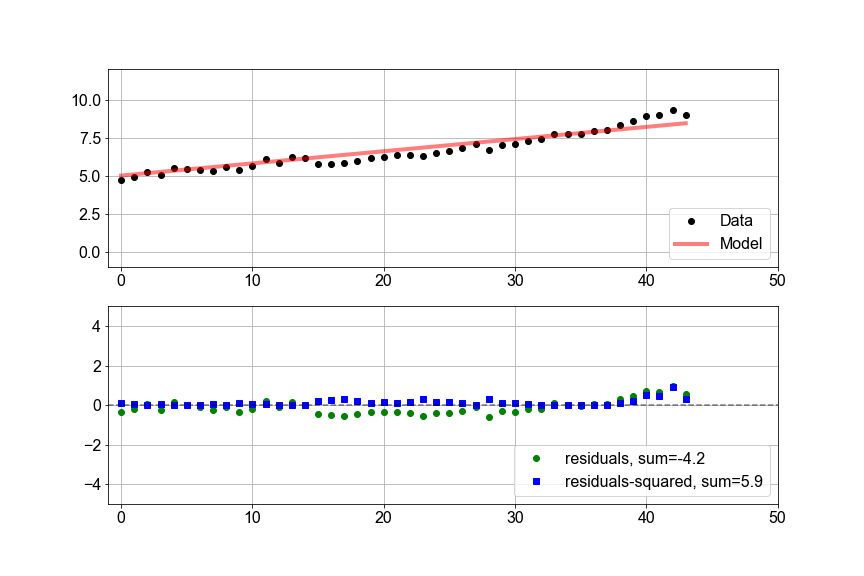
2 panel figure, top plot scatter of sea level versus time and line plot of a better model, then bottom plot of residuals as green dot markers and squared residuals as blue square markers, but with a much better fit


RSS = np.sum(np.square(y_model - y_data))
print(RSS)
5.9
Nhập môn Mô hình tuyến tính với Python

Variation of RSS

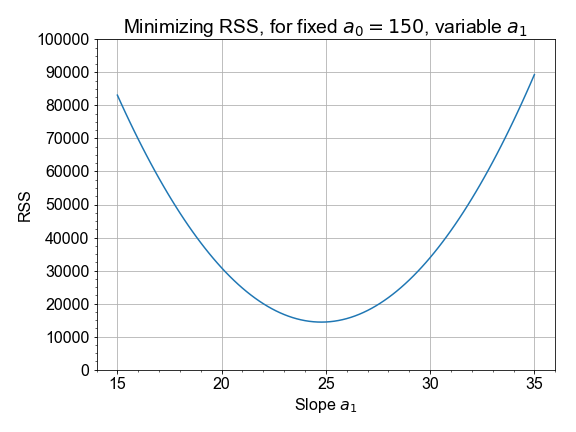
Plot of RSS y-axis values versus slope x-axis values, shaped as an up-turned parabola or well, with minimum at the bottom near slope=25

  • Minimum value of RSS gives minimum residuals
  • Minimum residuals give the best model
Nhập môn Mô hình tuyến tính với Python

Let's practice!

Nhập môn Mô hình tuyến tính với Python

Preparing Video For Download...