Model Errors and Randomness

Nhập môn Mô hình tuyến tính với Python

Jason Vestuto

Data Scientist

Types of Errors

  1. Measurement error
    • e.g.: broken sensor, wrongly recorded measurements
  2. Sampling bias
    • e.g: temperatures only from August, when days are hottest
  3. Random chance
Nhập môn Mô hình tuyến tính với Python

Null Hypothesis

Question: Is our effect due a relationship or due to random chance?

Answer: check the Null Hypothesis.

Nhập môn Mô hình tuyến tính với Python

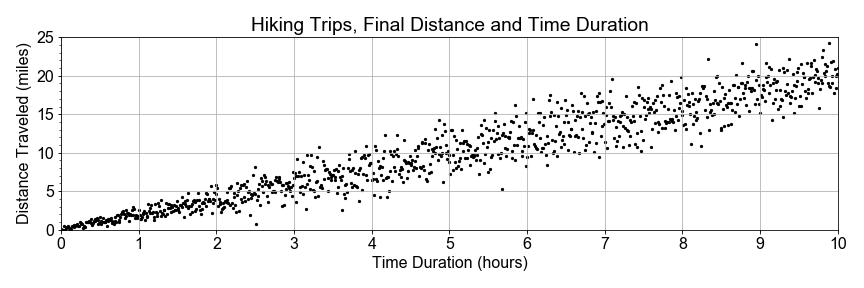
Ordered Data

Scatter plot of hiking trip data, plotted on axes distance traveled in miles versus time duration in hours

Nhập môn Mô hình tuyến tính với Python

Grouping Data

Scatter plot of hiking trip data, plotted on axes distance traveled in miles versus time duration in hours, with times less than 5 hours shown in red, and times greater shown in blue

Nhập môn Mô hình tuyến tính với Python

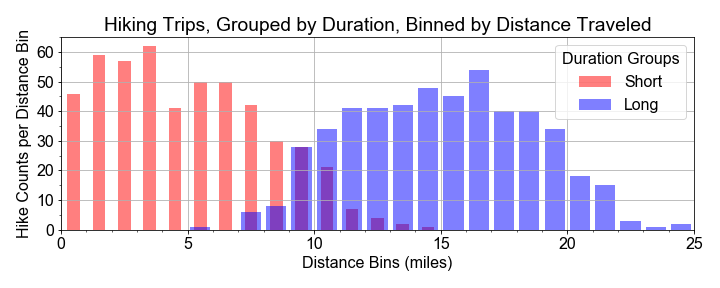
Grouping Data

Two histograms plotted, each roughly bell shaped, one in red for short duration trips, centered near 5 miles, and one in blue for long duration trips, centered near 15 miles

  • Short Duration Group, mean = 5
  • Long Duration Group, mean = 15
Nhập môn Mô hình tuyến tính với Python

Test Statistic

# Group into early and late times
group_short = sample_distances[times < 5]
group_long = sample_distances[times > 5]
# Resample distributions
resample_short = np.random.choice(group_short, size=500, replace=True)
resample_long = np.random.choice(group_long, size=500, replace=True)
# Test Statistic
test_statistic = resample_long - resample_short
# Effect size as mean of test statistic distribution
effect_size = np.mean(test_statistic)
Nhập môn Mô hình tuyến tính với Python

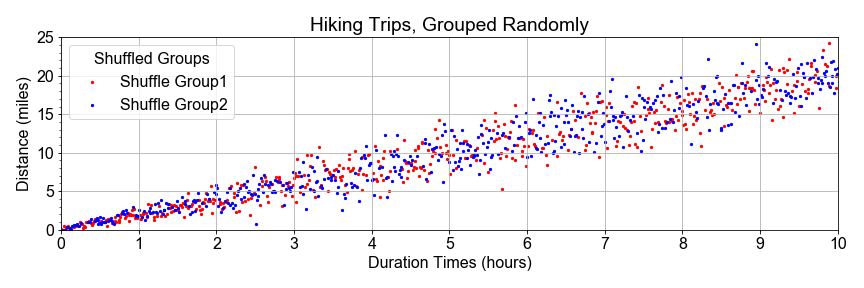
Shuffle and Regrouping

Scatter plot of hiking trip data, plotted on axes distance traveled in miles versus time duration in hours, with red and blue appearing interspersed throughout all data for all time durations

Nhập môn Mô hình tuyến tính với Python

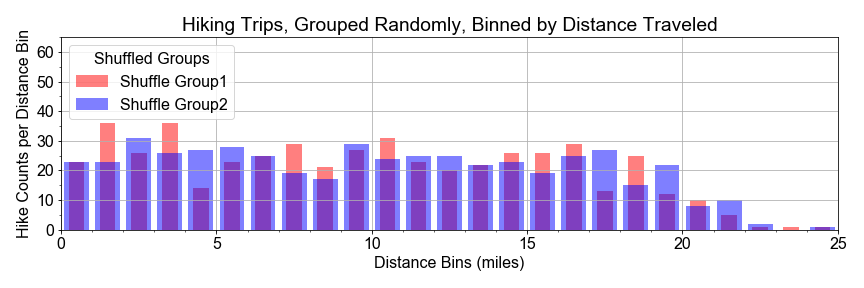
Shuffling and Regrouping

2 histograms overlapping almost entirely, spreading from 0 to 25 miles, of roughly the same shape

Nhập môn Mô hình tuyến tính với Python

Shuffle and Split

# Concatenate and Shuffle
shuffle_bucket = np.concatenate((group_short, group_long))
np.random.shuffle(shuffle_bucket)
# Split in the middle
slice_index = len(shuffle_bucket)//2
shuffled_half1 = shuffle_bucket[0:slice_index]
shuffled_half2 = shuffle_bucket[slice_index+1:]
Nhập môn Mô hình tuyến tính với Python

Resample and Test Again

# Resample shuffled populations
shuffled_sample1 = np.random.choice(shuffled_half1, size=500, replace=True)
shuffled_sample2 = np.random.choice(shuffled_half2, size=500, replace=True)
# Recompute effect size
shuffled_test_statistic = shuffled_sample2 - shuffled_sample1
effect_size = np.mean(shuffled_test_statistic)
Nhập môn Mô hình tuyến tính với Python

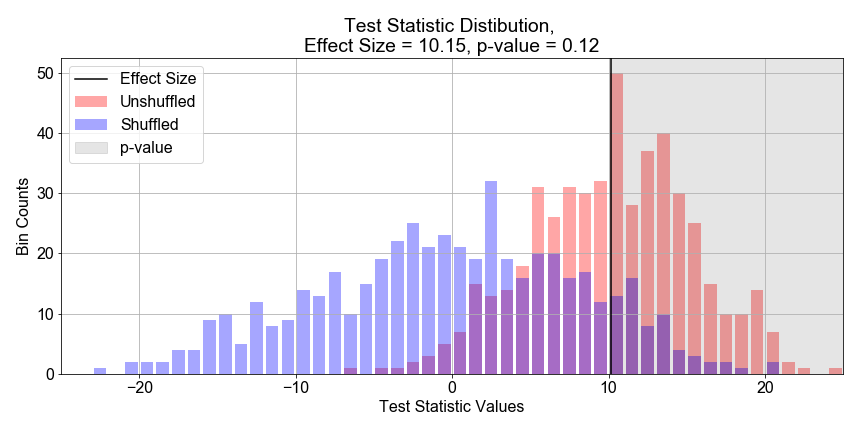
p-Value

Plotted on axes bin counts versus test statistic value bins, two histograms, one in blue centered on x=0 with wide spread, one in red centered on x=10 with narrower spread, and a vertical back line at x=10

Nhập môn Mô hình tuyến tính với Python

Let's practice!

Nhập môn Mô hình tuyến tính với Python

Preparing Video For Download...